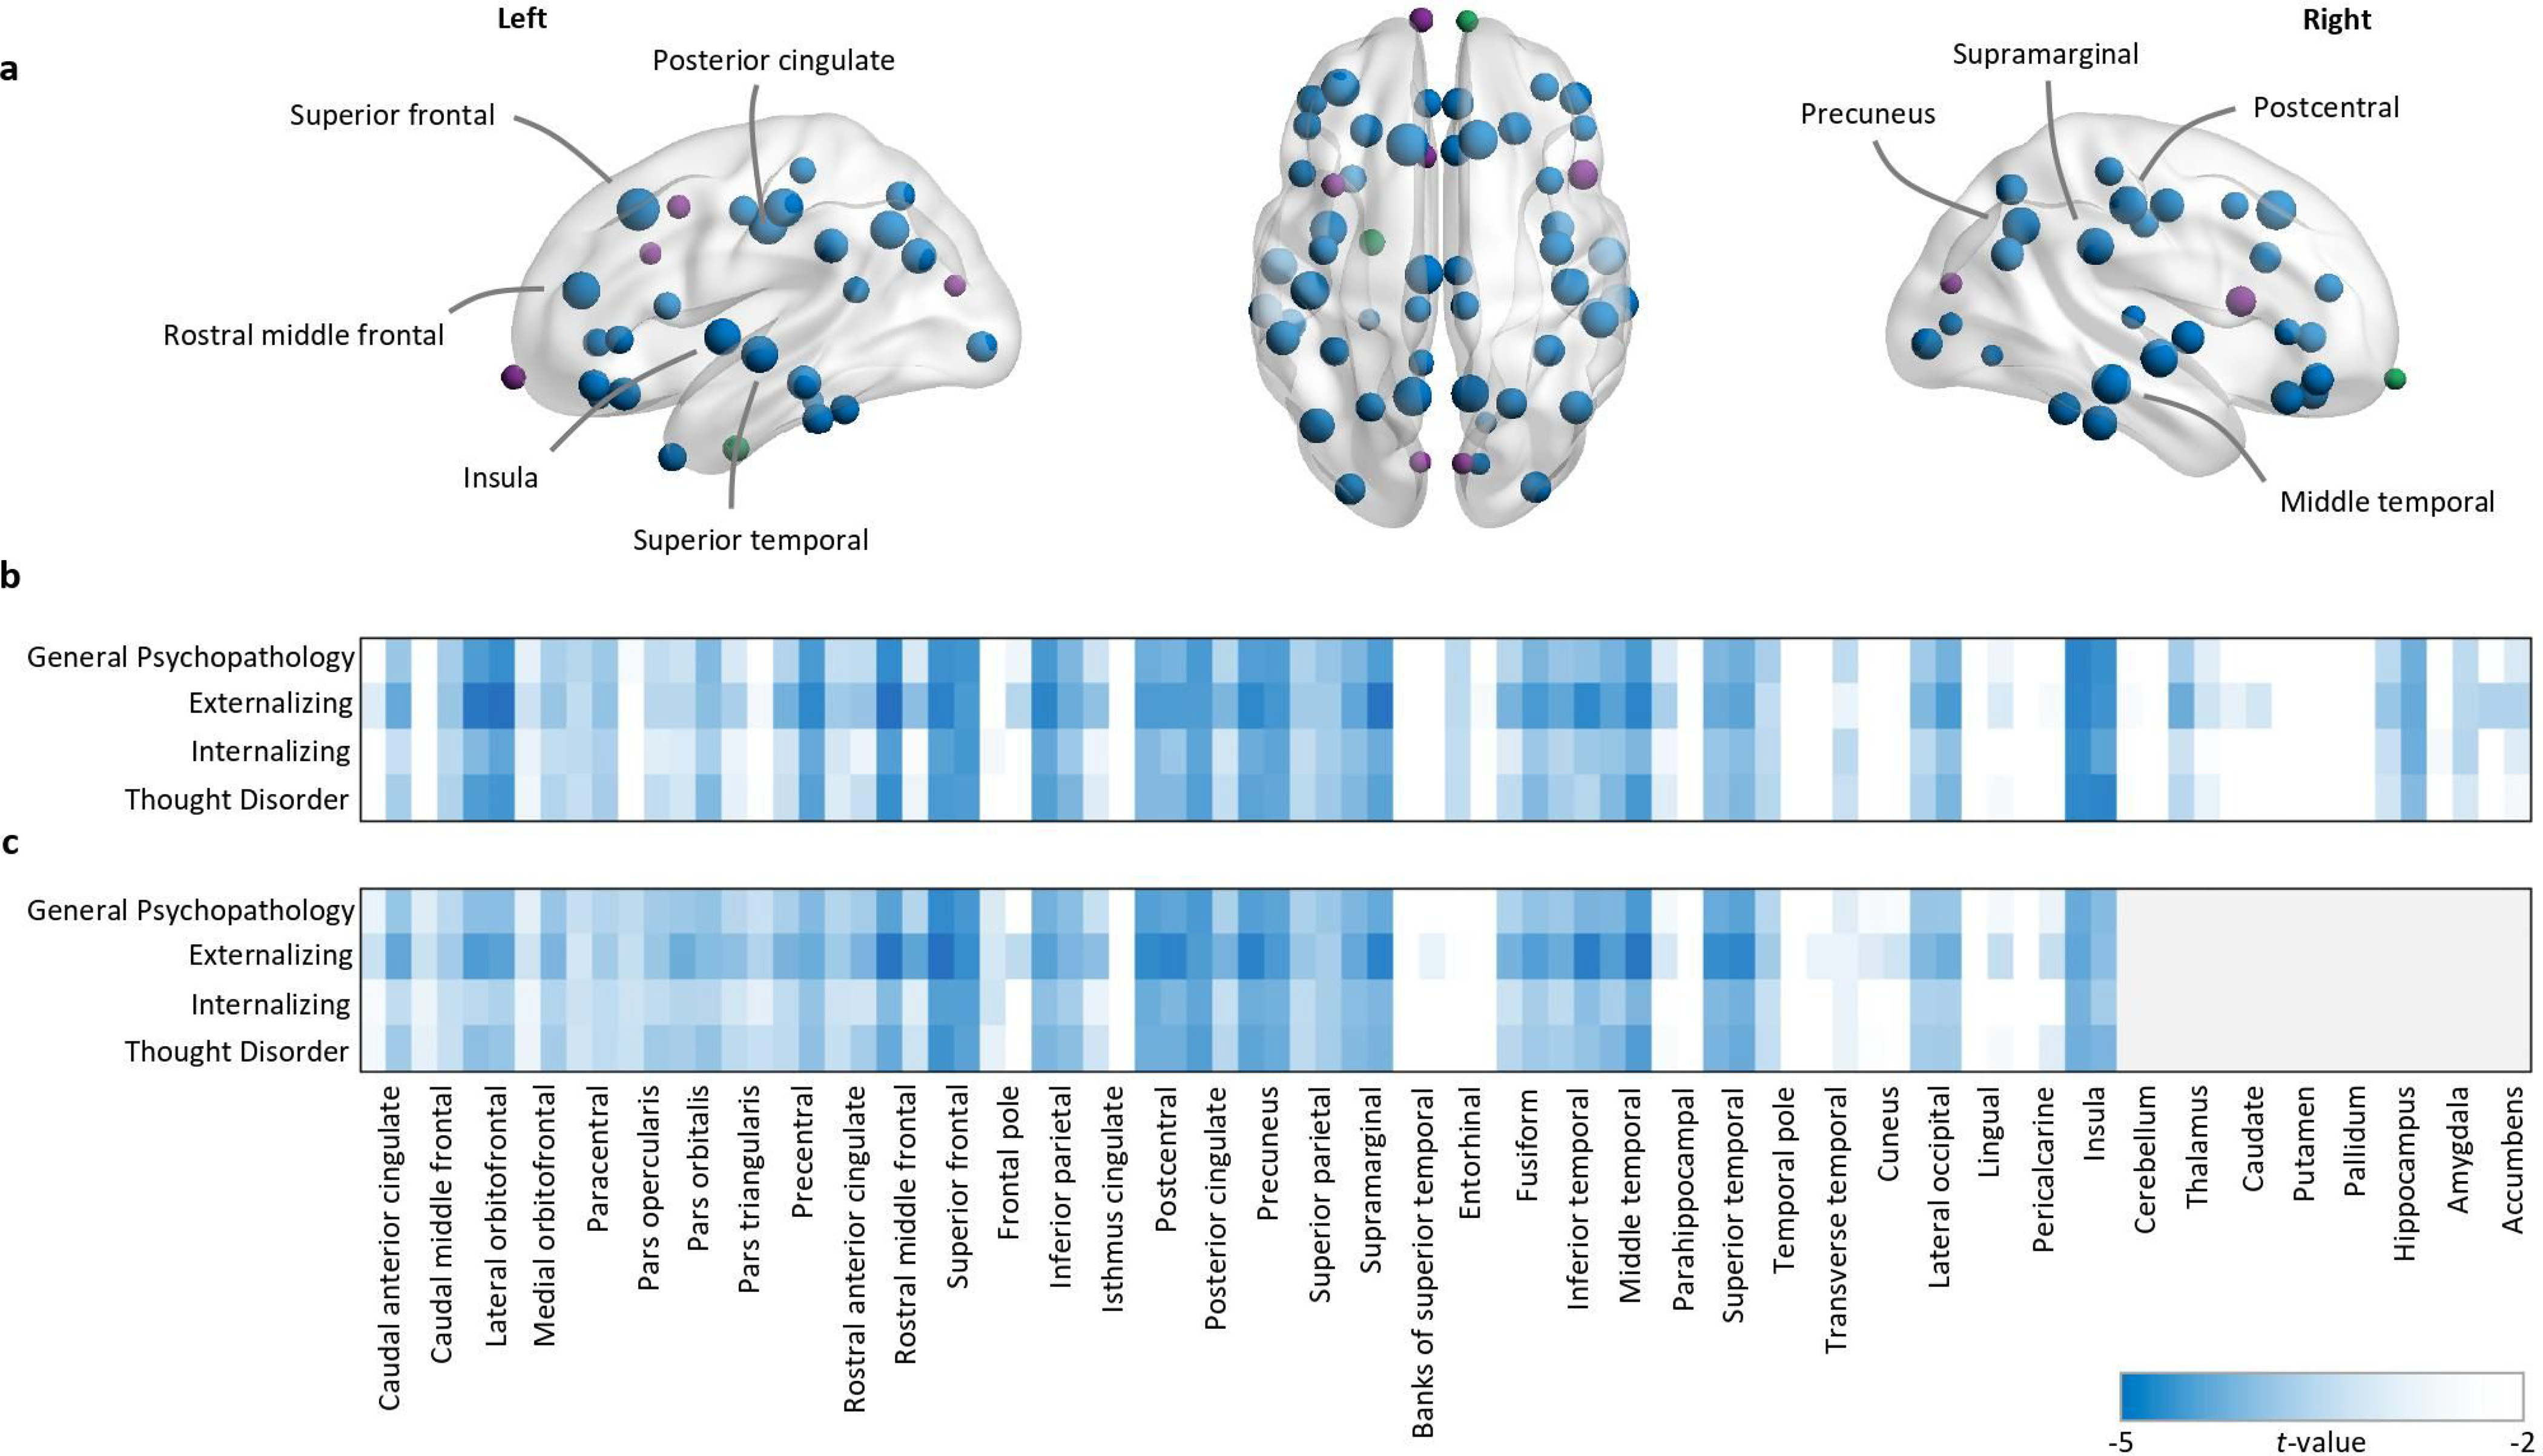
Figure 2:

In the baseline model, controlling for sex and race/ethnicity, psychopathology was associated with lower volume and surface area. a Regions exhibiting significantly lower volume and surface area (blue nodes), volume-only (green nodes), or surface area-only (purple nodes), mapped for the general psychopathology dimension. Regions with the strongest loadings are labelled (t<3.5). Node size represents the t values. b-c t values for all psychopathology dimensions and volumetric (b) or surface area (c) associations, ordered left hemisphere-right hemisphere for each cortical (n=68) and subcortical (n=16) region where non-significant findings are coded white.
