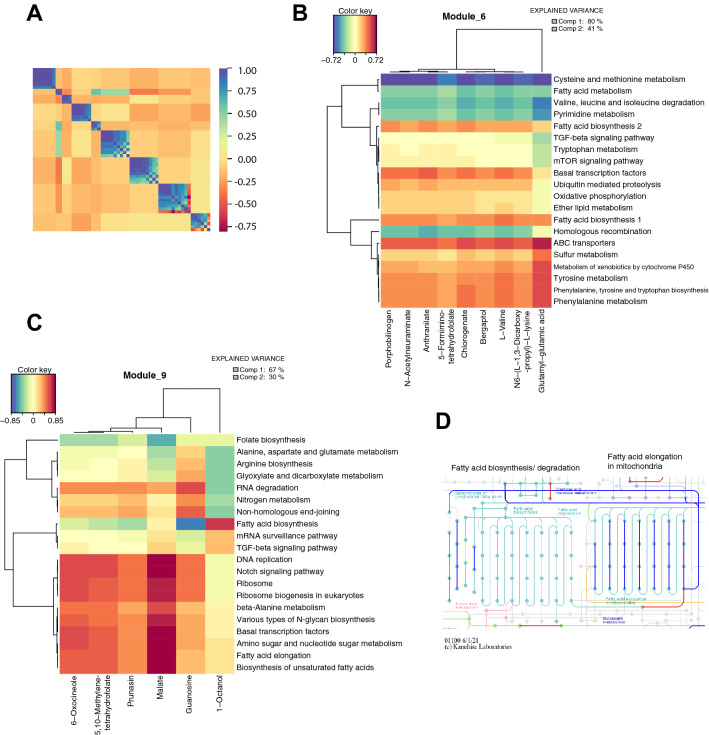
Figure 2.
Integration analysis highlights gene-metabolite pathway relationships. (A) Modulated Modularity Clustering (MMC) analysis in which a smooth correlation ordering is performed in order to differentiate blocks of metabolites with the same behavior. Metabolites were grouped into 9 different modules. Blue is positively correlated and red is negatively correlated. (B,C) Heatmaps28 of Modules 6 (B) and 9 (C) after a sparse PLS (sPLS) analysis was performed with the Gene/Metabolite Integration Tool28. Metagenes were estimated from the PANA approach9. (D) Representations of C. elegans fatty acid metabolic pathways in KEGG31. Genes significantly downregulated in bcat-1(RNAi) worms are blue, and genes significantly upregulated in bcat-1(RNAi) worms are red.

