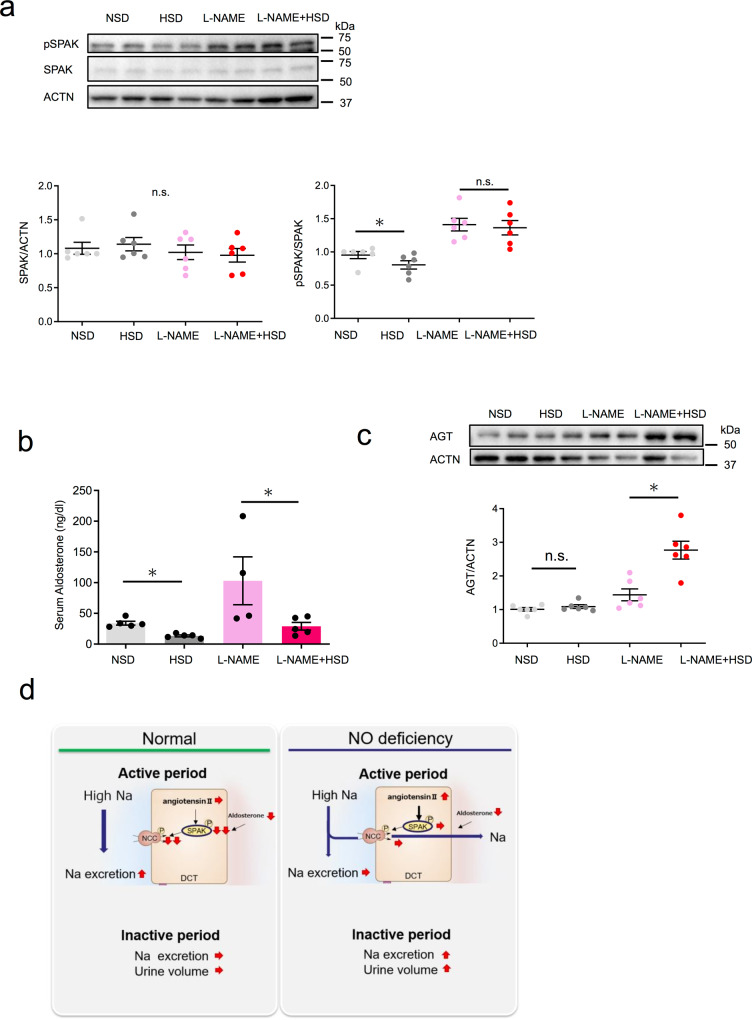
Fig. 5. Intrarenal angiotensin II activates the SPAK–NCC pathway.
a Representative immunoblotting (above) and quantitative analysis (below) of renal phosphorylated SPAK and total SPAK in the active phase in the four groups (n = 6 mice per group). Statistical analysis was performed using two-way ANOVA. b Serum aldosterone levels among the four groups (NSD, HSD, L-NAME + HSD: n = 5, l-NAME: n = 4). Statistical analysis was performed using the Tukey–Kramer method. c Representative immunoblotting (above) and quantitative analysis (below) of renal AGT (angiotensinogen) in the active phase among the four groups. Each point is presented as the mean ± SEM. *p < 0.05 (n = 6 mice per group). Statistical analysis was performed using two-way ANOVA. d Schematic summary illustrating the regulation of sodium and urine via the angiotensin II-SPAK–NCC pathway in the kidney of our novel nocturnal polyuria mouse mode. All data are expressed as the mean ± SEM, *p < 0.05.

