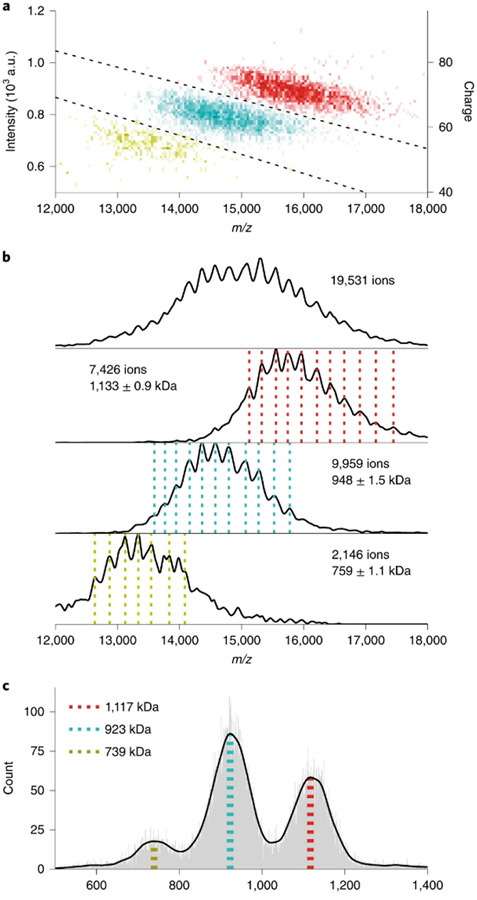
Figure 15.
Two-dimensional histogram of single-ion signals measured using Orbitrap CDMS of immunoglobulin-M oligomers (A), m/z of histograms of single-particle centroids illustrating m/z overlap (B), and corresponding mass histograms (C). Reprinted with permission from ref. 379. © 2020 Springer Nature America, Inc.

