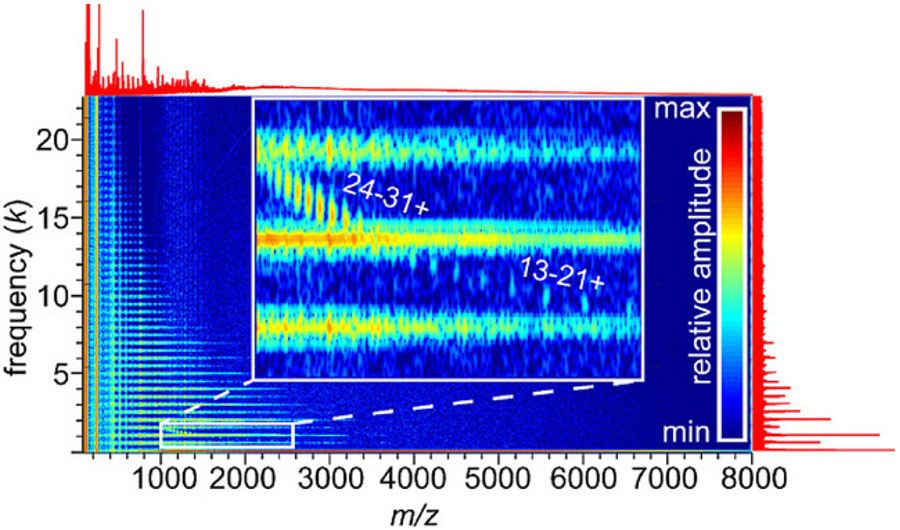
Figure 24.
Mass spectrum of native-like anthrax toxin Lethal Factor N-terminal domain electrosprayed from Tris/sodium chloride buffer, (top red trace), corresponding Fourier spectrum (right red trace), and Gabor spectrogram (heat map), illustrating separation of negatively-chirped protein signal (labeled according to charge state in inset) and sodium chloride clusters (horizontal bands). Note that cluster ion and protein ions signals are strongly overlapped in both m/z and frequency but are easy to identify in the Gabor spectrogram. Reprinted with permission from ref. 298. © 2019 Wiley-VCH Verlag GmbH & Co.

