Figure 3.

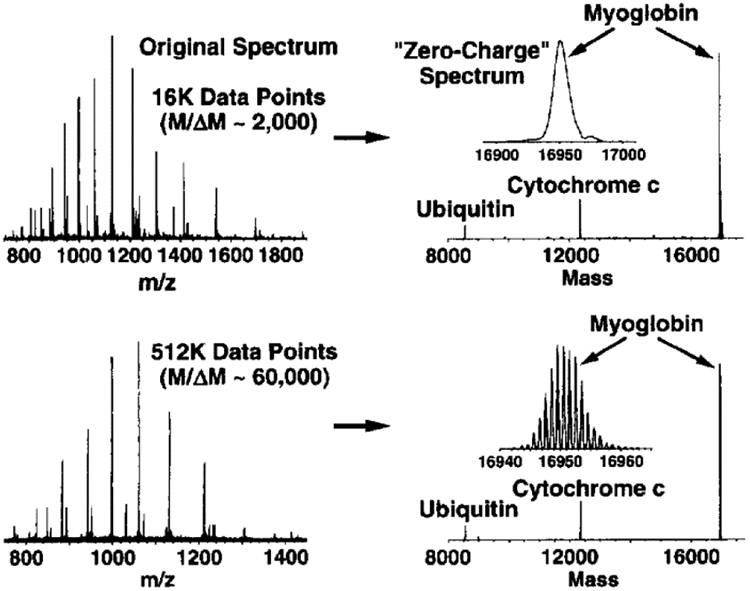
Deconvolution (right) of both low (top) and high (bottom) resolution ESI mass spectra (left) for a mixture of three proteins using Zscore. Reprinted with permission from ref. 212. © 1998 American Society for Mass Spectrometry.

Deconvolution (right) of both low (top) and high (bottom) resolution ESI mass spectra (left) for a mixture of three proteins using Zscore. Reprinted with permission from ref. 212. © 1998 American Society for Mass Spectrometry.