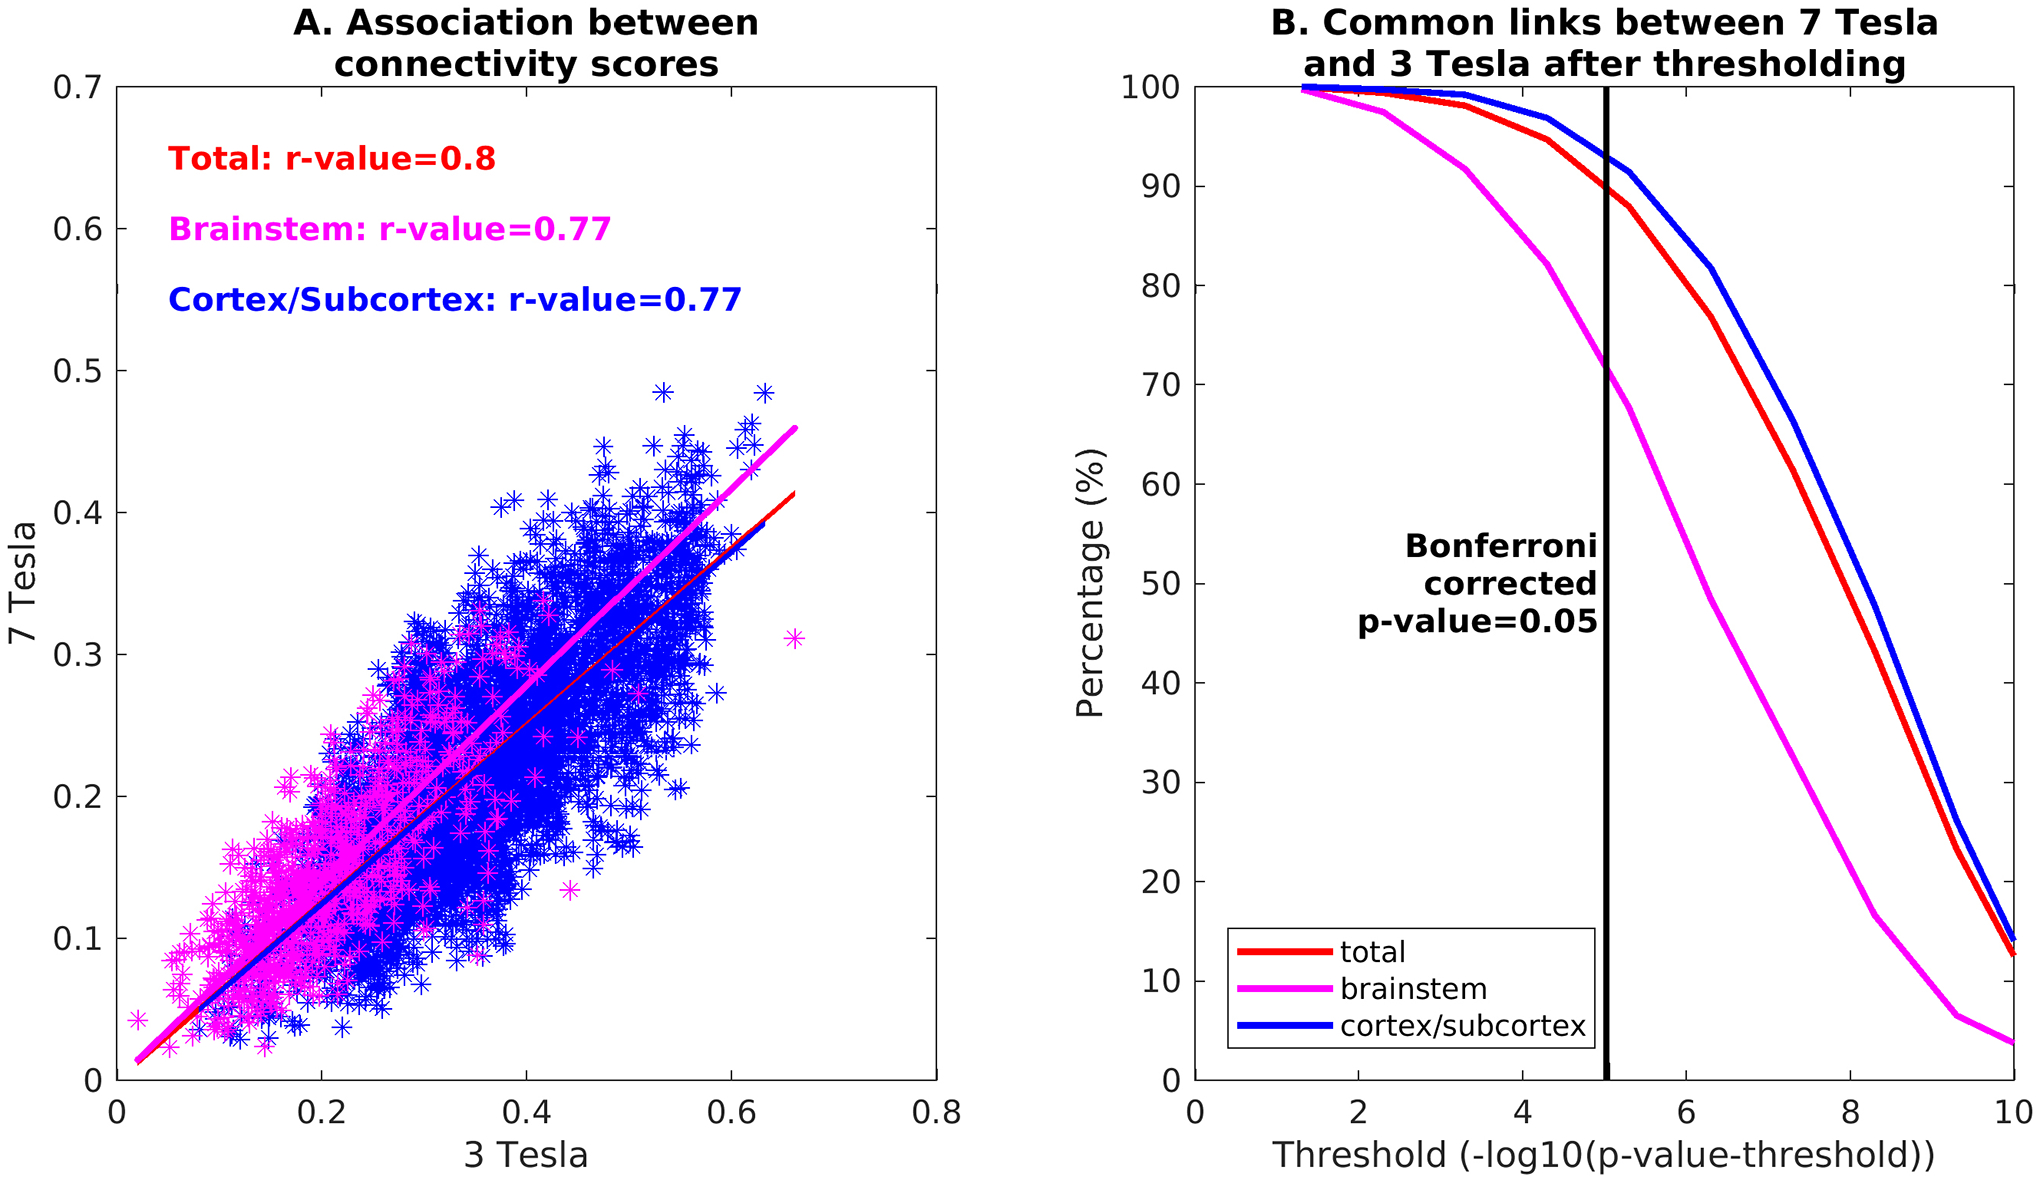
Figure 11). Comparison between 3 Tesla and 7 Tesla connectivity results:

A) Association between connectivity scores (averaged across subjects and unthresholded) across scanners for the full seeds-to-brain connectome (red), seeds-to-brainstem connectome (magenta), and seeds-to-others (blue). B) Percentage of links in common between 7 Tesla and 3 Tesla results, computed for the full seeds-to-brain matrix (red), seeds-to-brainstem matrix (magenta) and seeds-to-others matrix (blue), with respect to different uncorrected statistical thresholds. The vertical line marks the p=0.05 threshold, Bonferroni corrected.
