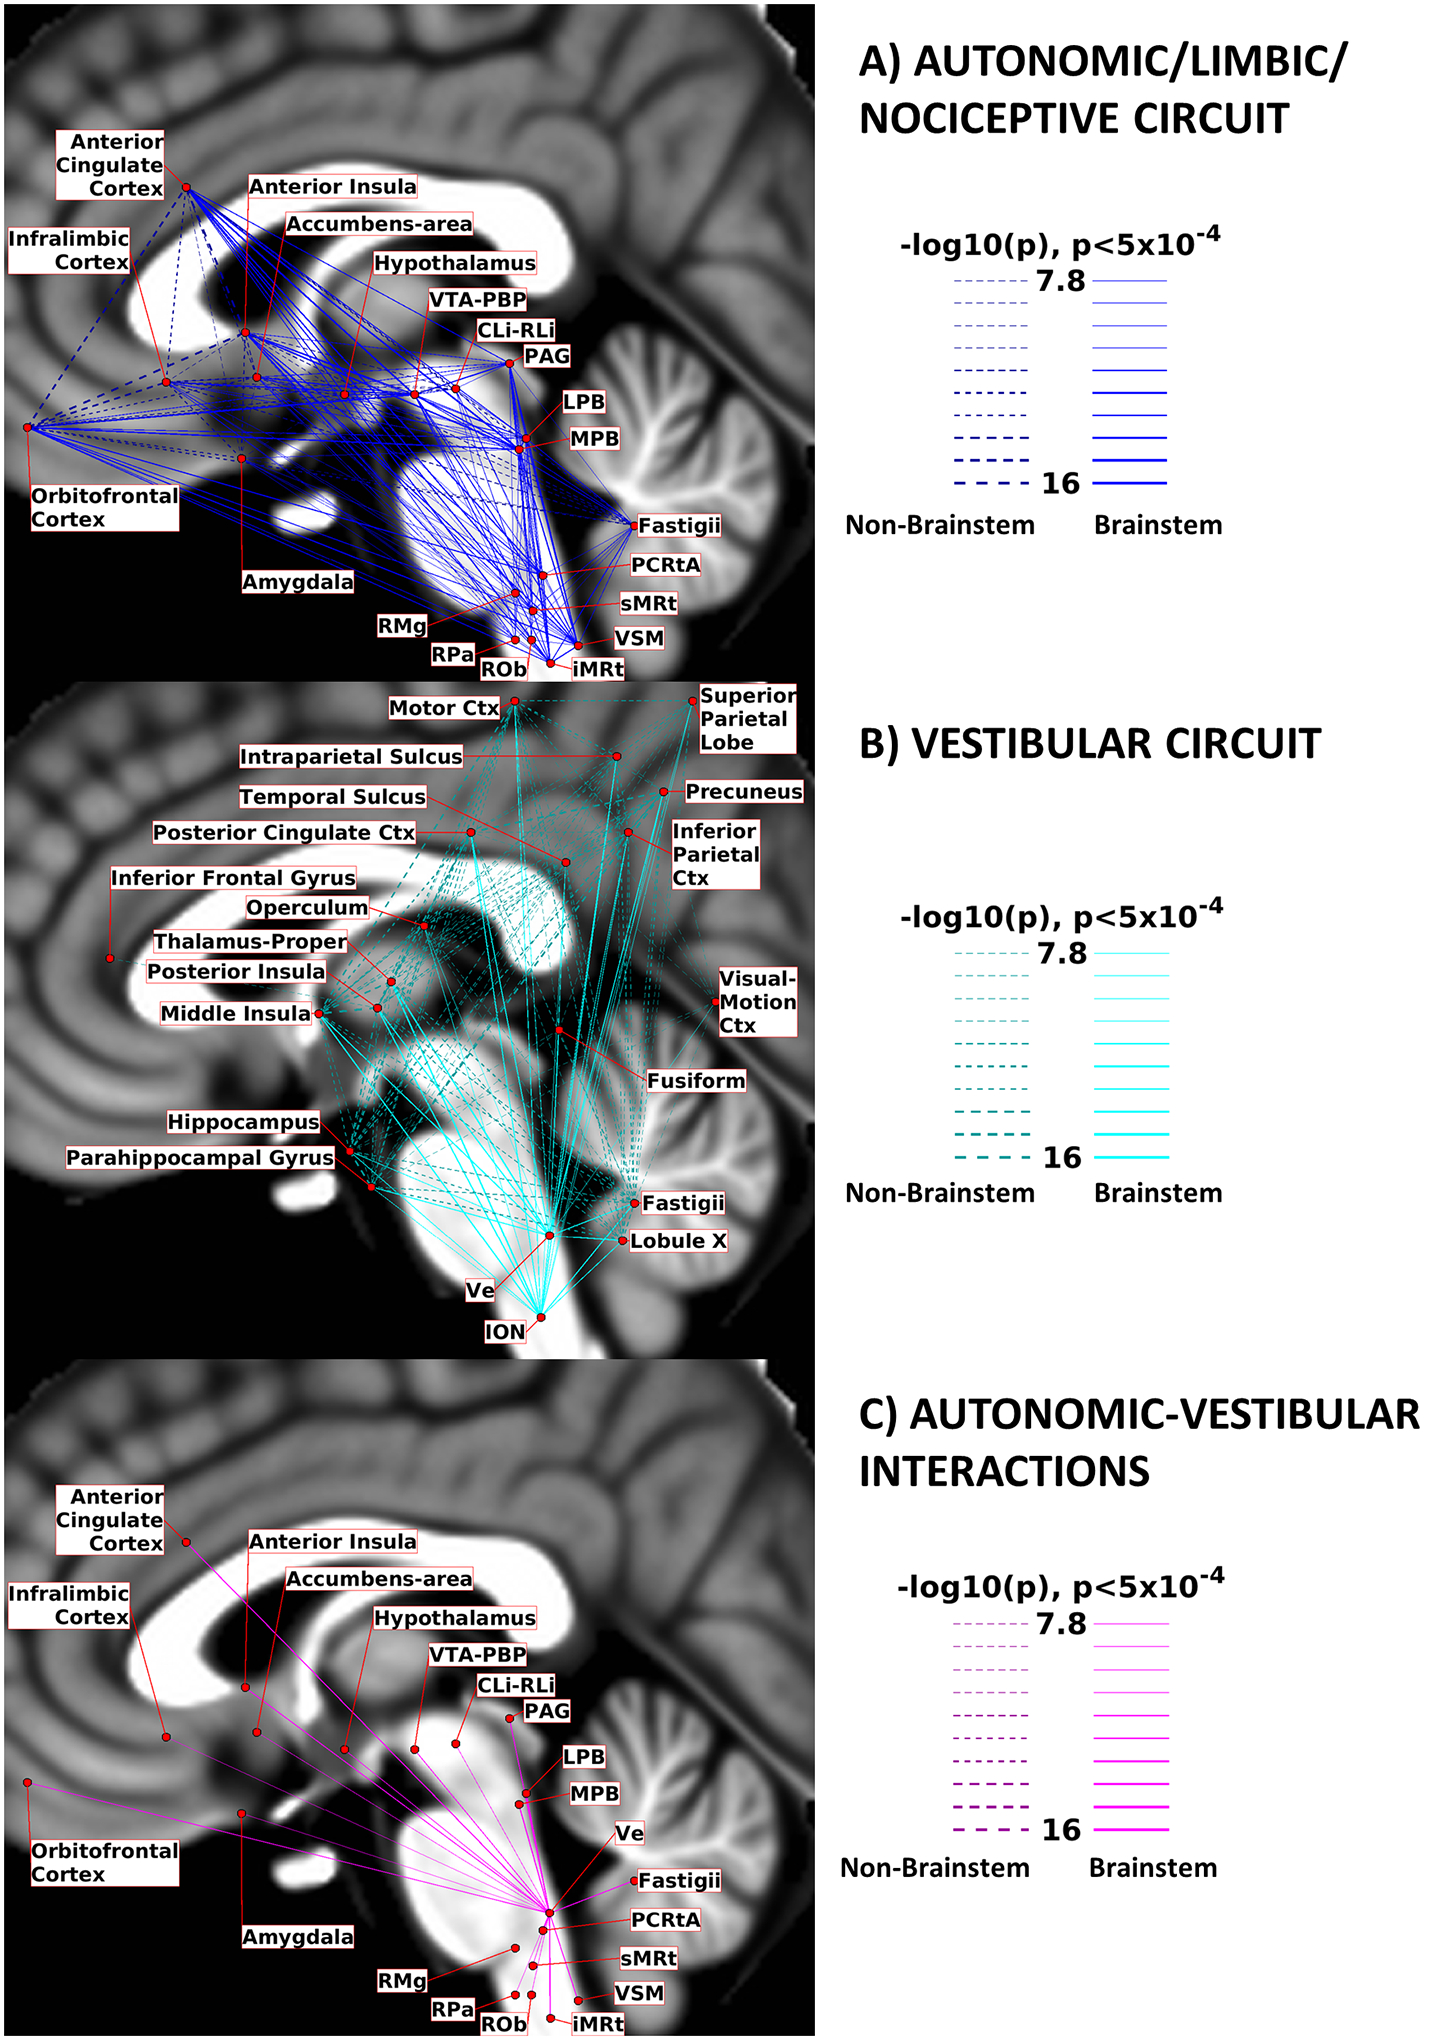
Figure 12). Circuit Diagrams:

we summarize here the links among nodes of interest for A) the Autonomic/Limbic/Nociceptive circuit, B) the Vestibular circuit and C) the interactions between Ve and autonomic nodes. Brainstem-to-brainstem connections are displayed with solid lines, while other connections are displayed with dashed lines. Line thickness is proportional to its –log10(p) value, thresholded at p<0.0005, Bonferroni corrected. The nodes positions (region centroids) were projected on the sagittal slice at coordinate x=−2 of the T1-weighted MNI template, with small adjustments in their positions to avoid node/link crowding.
