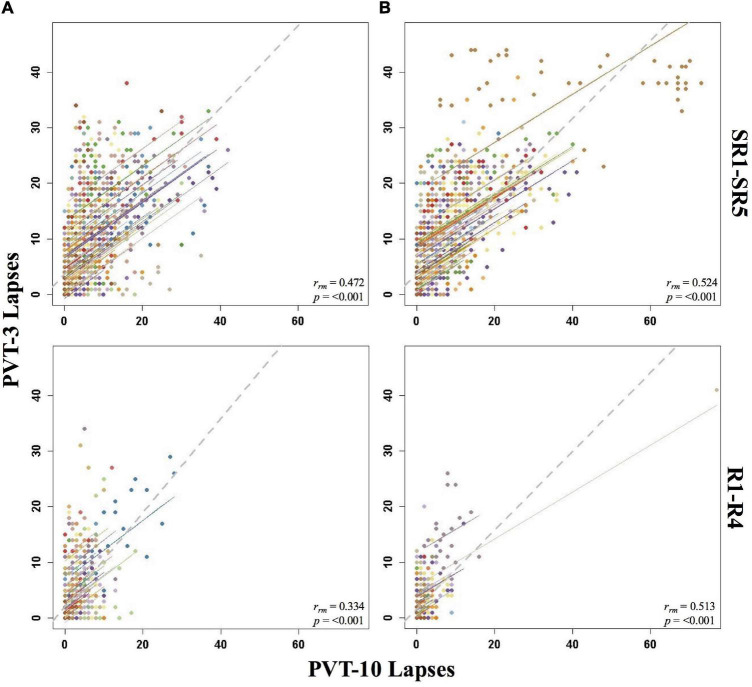
FIGURE 1.
Rmcorr plots of repeated-measures correlations between 10-min Psychomotor Vigilance Test (PVT-10) and 3-min Psychomotor Vigilance Test (PVT-3) lapses by study phase for Condition A (A) and Condition B (B). Each color represents a distinct participant with each point showing performance on both measures at one time point while the corresponding line shows the rmcorr fit for that participant (Bakdash and Marusich, 2020; R Core Team, 2020). The gray dashed line represents the regression line obtained by ignoring repeated measurements and treating the data as independent observations; rrm represents the common within-individual association (rmcorr). Rmcorr effect sizes were interpreted as follows: 0.00–0.29, negligible; 0.30–0.49, weak; 0.50–0.69, moderate; 0.70–0.89, strong; and 0.90–1.00, very strong. Included time points for study phases were as follows: sleep restriction day one from 0800 h through sleep restriction day five at 2000 h (SR1-SR5) and recovery day one from 1000 h through recovery day four at 2000 h (R1-R4).

