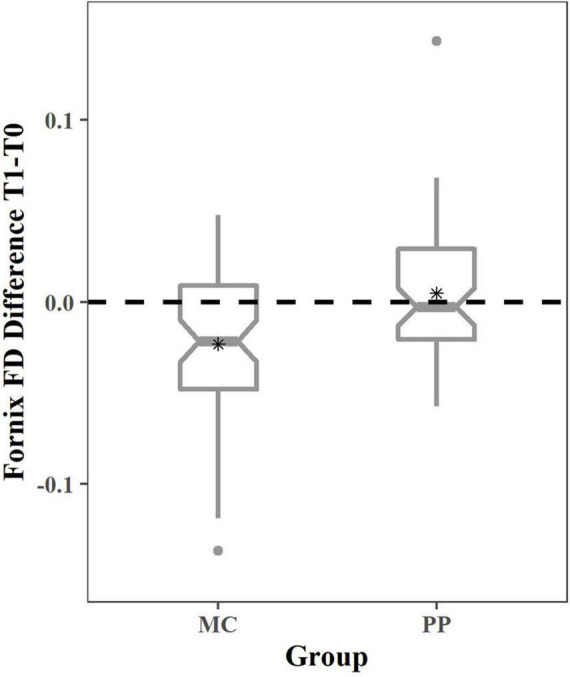
FIGURE 2.

Fiber density change in MC and PP in the fornix. Boxplots depicting the change in FD for the MC and PP group. The dotted line represents no change over time and asterisks (*) depict the group mean. One-sample t-tests revealed no significant change over time in PP and significant FD decrease in MC. T0, baseline measurement; T1, 6 months measurement; MC, music listening/musical culture; PP, piano practice.
