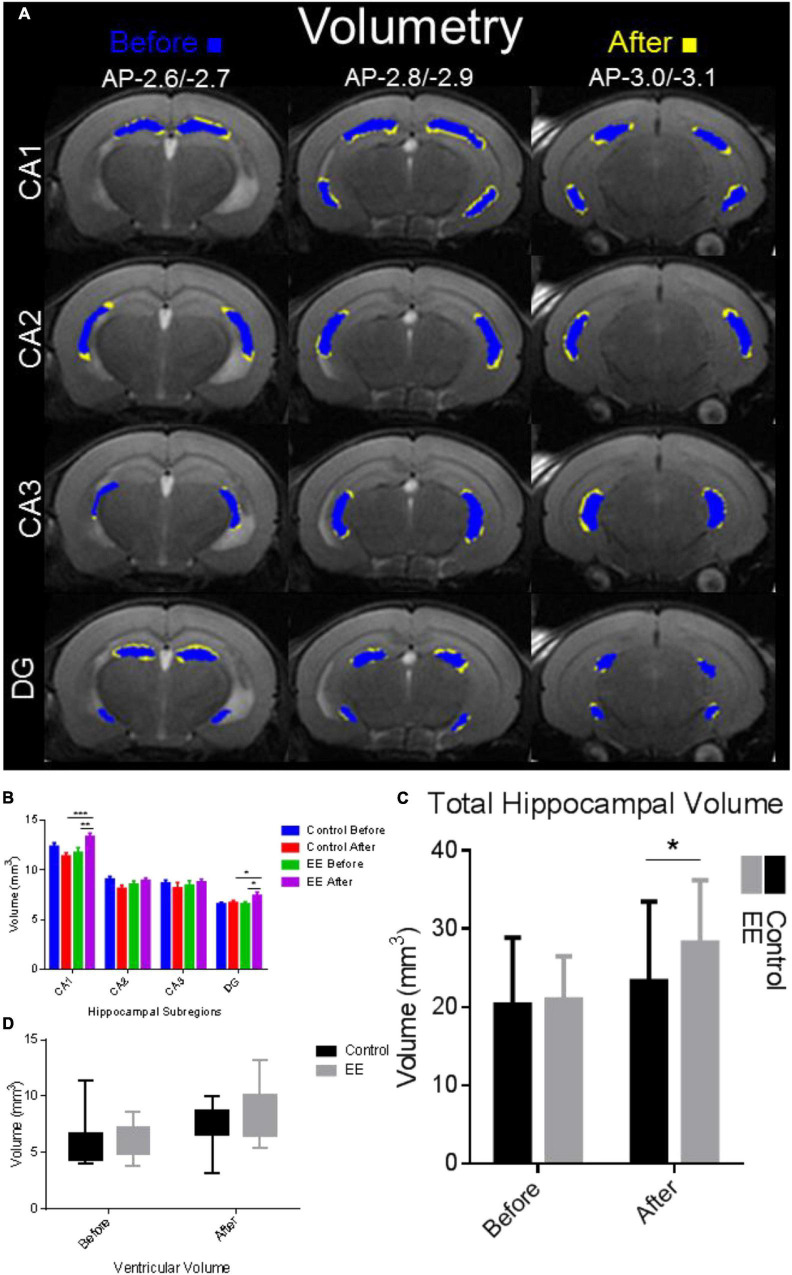
FIGURE 2.
Hippocampal complex volume alterations due to environmental enrichment. (A) Volumetry for hippocampal subdivisions. Blue indicates the time point before and yellow indicates the time point after 30 days of EE and SE. The hippocampal complex was delineated manually using the T2 image map from slices AP-2.6/–2.7, AP-2.8/–2.9 to AP-3.0/3.1 (first, second, third rows, respectively; Franklin and Paxinos, 2008). The volume (in mm3) of each hippocampal subdivision was determined and compared with the time points before and after in the EE group and SE control group. (B) Volume delineations from the hippocampal subdivisions in mm3. CA1 volume was significantly increased for the after-EE time point compared with the before EE time point (***p < 0.001), in addition to the control before/after time points (**p < 0.01). DG volume was significantly increased for the after-EE time point compared with the before-EE time point (*p < 0.05), in addition to the control before/after time points (*p < 0.05). (C) Total hippocampal volume was significantly increased in the after-EE group compared with the SE control group (*p < 0.05). (D) Ventricular volume was enlarged in the after-EE group, although insignificantly compared with the after-SE control group.

