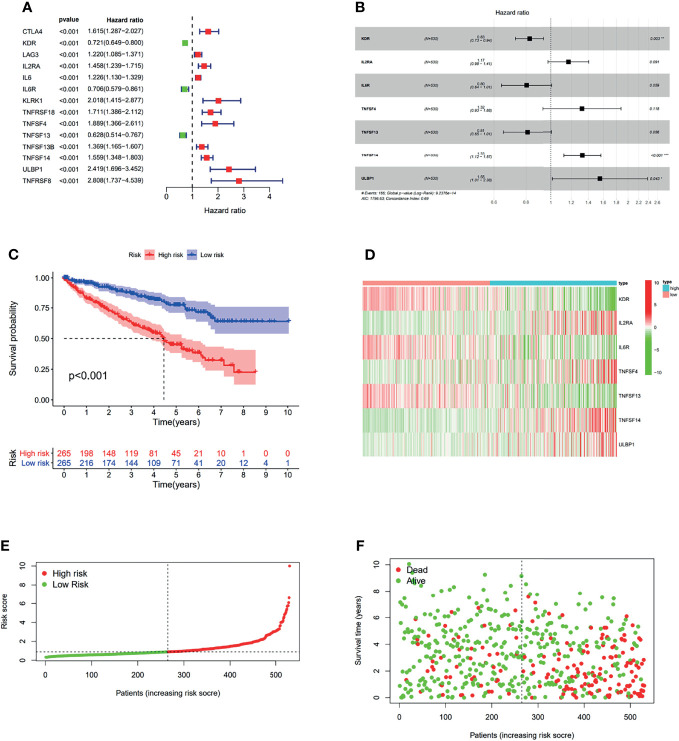
Figure 11.
The development of prognostic gene signatures based on 49 OIP5-associated immunomodulators. The hazard ratios of genes integrated into the prognostic signatures are shown in the forest plots for ccRCC (A, B). Kaplan–Meier curves for ccRCC regarding the risk scores (C). Distribution of risk scores, along with survival statuses, and gene expression profiles for ccRCC (D–F). *P < 0.05, **P < 0.005, ***P < 0.001.

