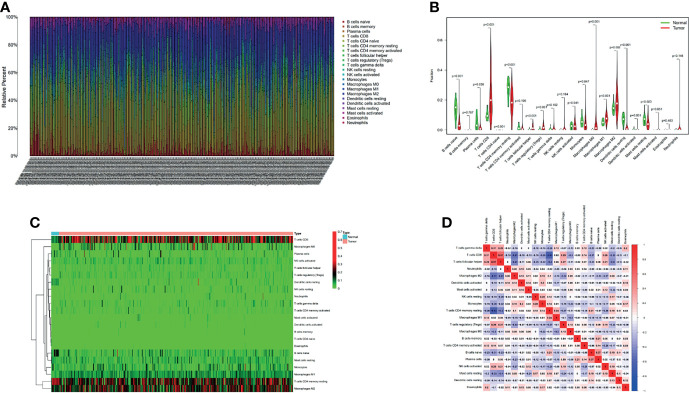
Figure 5.
The proportion of 22 immune cell infiltrates was assessed using Cell Type Identification By Estimating Relative Subsets Of RNA Transcripts method in ccRCC cohort of TCGA (A). Heatmaps and violin plots showed the differences in the immune cell distribution between malignant (red) and normal (blue) tissues in ccRCC cohorts (B, C). Different correlation patterns among immune cell subsets in ccRCC cohorts (D).

