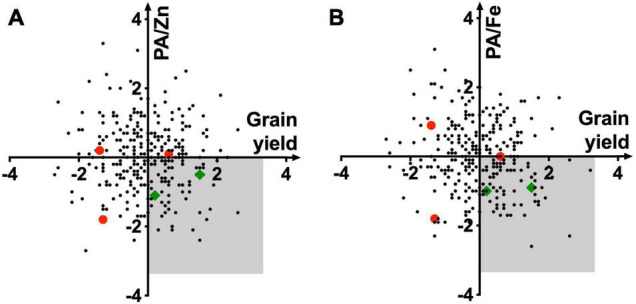
FIGURE 3.

Relationship of standardized PA/Zn (A) and PA/Fe (B) molar ratios with grain yield. Quadrangles representing wheat lines with high bioavailability of Zn and Fe and high grain yield are shaded in gray. Red dots and green diamonds represent wheat lines released as commercial varieties. PA, Fe, Zn, and yield data were averaged over 2015–2016 and 2016–2017 seasons.
