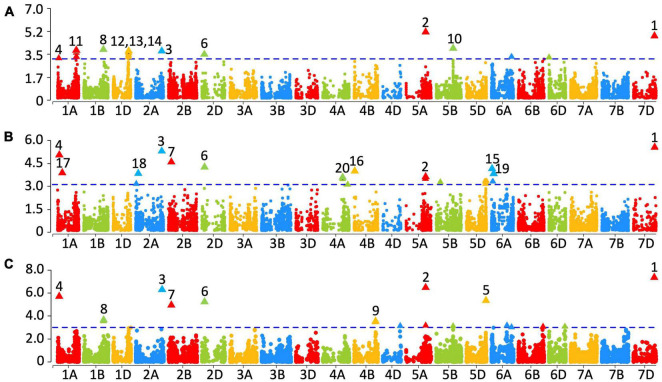
FIGURE 4.
Markers significantly associated with grain phytic acid from year 2015–2016 (A), 2016–2017 (B) and averaged over two years (C). The –log10 p-values are shown on the y-axis. Markers that were significant at a p-value of 0.001 are numbered: (1) BobWhite_c34689_116, (2) IACX8282, (3) RFL_Contig3550_457, (4) BS00009885_51, (5) Excalibur_c48387_58, (6) BS00069899_51, (7) RAC875_rep_c109207_706, (8) RAC875_rep_c109215_398, (9) Kukri_c9545_864, (10) RAC875_c39141_55, (11) Excalibur_c1236_444, (12) Ra_c15730_3403, (13) Excalibur_c16570_925, (14) D_GDS7LZN02GSCOW_131, (15) RFL_Contig2815_1135, (16) BS00063809_51, 17) BS00048118_51, (18) Tdurum_contig48302_532, (19) BobWhite_c23888_124, (20) and Excalibur_rep_c70578_299.

