FIGURE 6.

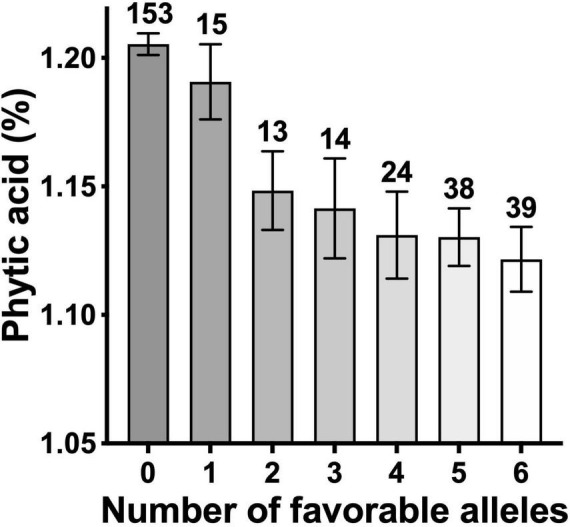
Phytic acid content in wheat lines as a function of number of favorable alleles. The number of lines in each group are shown on top of respective bars.

Phytic acid content in wheat lines as a function of number of favorable alleles. The number of lines in each group are shown on top of respective bars.