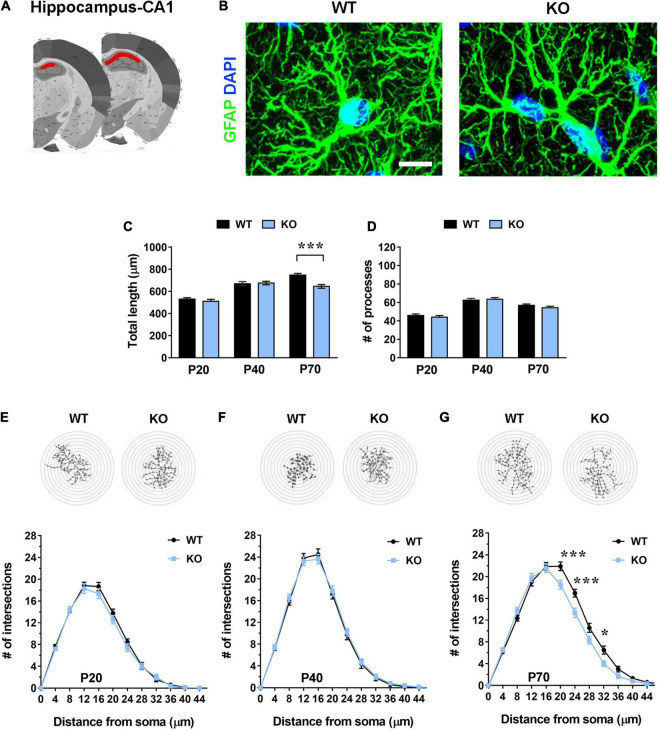
FIGURE 3.
Hippocampal (CA1 pyramidal layer) Mecp2 KO astrocytes manifest signs of cytoskeletal atrophy only in severe symptomatic animals (P70), but not at earlier time points. (A) Representative images of brain coronal sections, with the CA1 of dorsal hippocampus highlighted in red. (B) Micrographs are representative images of WT and Mecp2 KO astrocytes immunostained for GFAP (green) and DAPI (blue) in the CA1 pyramidal layer of the hippocampus at P70. Scale bar = 10 μm. (C,D) The graphs show the total length of processes (C) and their number (D) in Mecp2 KO astrocytes, compared to WT astrocytes, in the CA1 of dorsal hippocampus of P20, P40, and P70 mice. Data are represented as mean ± SEM. ***p < 0.001 by Student’s t-test or Mann–Whitney test in accordance with data distribution. One-way ANOVA indicates a progressive and significant increase in the total length of processes of WT astrocytes (from P20 to P40 p < 0.001; from P40 to P70 p < 0.01), and an arrest of growth at P40 in KO cells (from P20 to P40 p < 0.001). The number of processes increases from P20 to P40 (p < 0.001) and slightly decreases at P70 in both WT (p = 0.061) and KO (p < 0.01) astrocytes. (E–G) The graphs depict data from Sholl analysis, reporting the number of intersections of WT and Mecp2 KO astrocyte processes with concentric circles, at P20 (E), P40 (F), and P70 (G). Representative images of reconstructed astrocyte arbors by SNT plugin are reported above each graph. *p < 0.05, ***p < 0.001 by two-way ANOVA, followed by Sidak’s multiple comparison test. WT and Mecp2 KO astrocytes (P20: n = 36 WT and n = 36 KO; P40: n = 27 WT and n = 45 KO; P70: n = 36 WT and n = 36 KO; n indicates the number of cells) derived from at least three different animals per genotype (P20: N = 4 WT and N = 4 KO; P40: N = 3 WT and N = 5 KO; P70: N = 4 WT and N = 4 KO; N indicates the number of animals).

