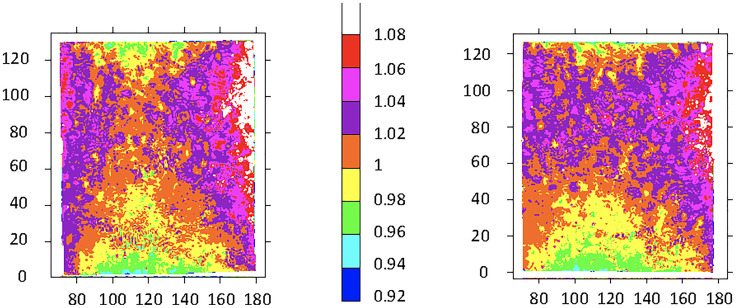
Figure 3.
Test film results from two OCs exposed to 150 Gy. The target dose delivered was 150 Gy. The color scale represents proportional arbitrary scanning laser densitometry units normalized to 312 SLD units left, and to 320 SLD units right. The boundary between orange and yellow was assigned a value of 1. Horizontal axis: units in mm relative to the scanner base plate; vertical axis: distance in mm from the bottom of the film/container. See Figure 2 for the minimum dose locations (position F, bottom center of each film) and maximum dose locations (position H, at the side wall equator of each film).

