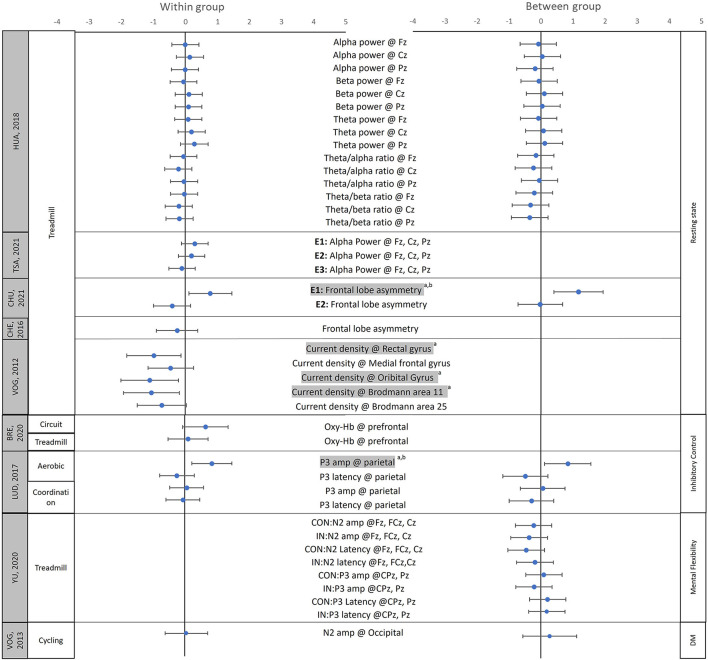
Figure 3.
Effect sizes of the acute neural effects after movement interventions. The mean (solid circle) and 95% CI of the Hedges' g effect sizes were provided for the studies focused on the acute effects of the physical activity/movement interventions. The data on the left side show the effect sizes for within-group comparisons (pre vs. post), while the data on the right side show the effect sizes for between-group comparisons (Experimental group vs. control group); aShows that the 95% CIs of within-group comparisons does not include 0; bShows that the 95% CIs of between-groups comparison does not include 0. Shaded variable indicates that 95% CIs of between- and/or within-group comparisons does not include 0; L, left; R, right; CON, Congruent condition during the Flanker task, IN, incongruent condition during the Flanker task; DM, decision making; Fz, Cz, Pz, FCz, CPz refer to the locations on the head according to the international 10–20 system. Oxy-Hb, concentration of the oxygenated hemoglobin; amp, amplitude. Please note that to ensure accuracy and to allow between-study comparisons, this table only includes the effect sizes of the outcome variables for which the means, standard deviation/standard error of means, and study sample sizes were provided by the original papers.

