FIGURE 3.
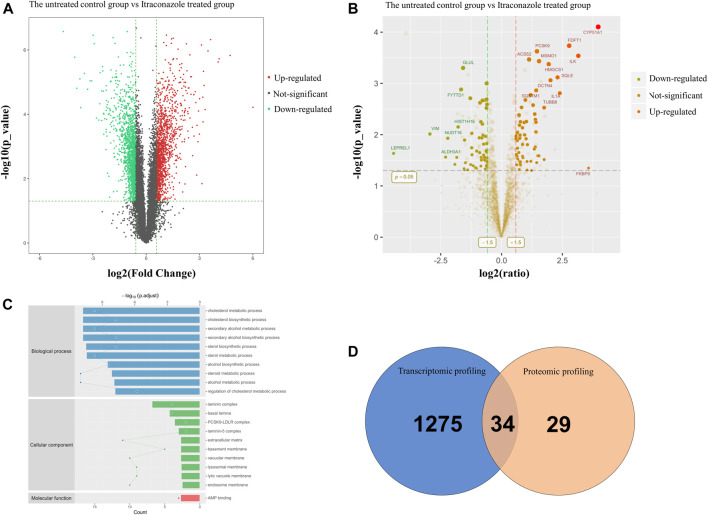
Transcriptomic and proteomic profiling of A431 cells treated with itraconazole. (A) Volcano plot of RNA-seq data. The horizontal line represents a p-value of .01, whereas the vertical lines correspond to 1.5-fold increase and decrease. (B) Volcano plot of iTRAQ data. The horizontal line represents a p-value of .05, whereas the vertical lines correspond to 1.5-fold increase and decrease. (C) GO enrichment analysis of BP, CC and MF. (D) The intersection of transcriptomic and proteomic profiling datasets showed overlap of 34 upregulated proteins in A431 cells.

