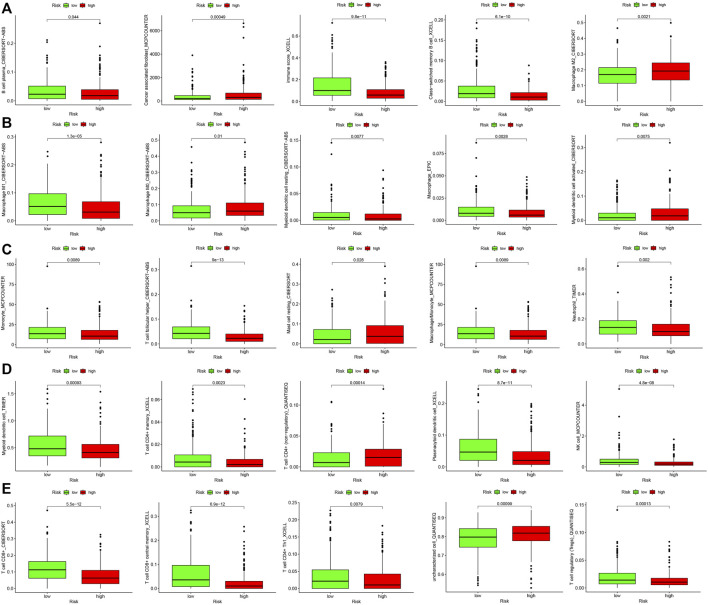
FIGURE 5.
Differential analysis of immune cell infiltration in high- and low-risk groups. (A) B cell plasma, Cancer associated fibroblast, Immune score, Class-switched memory B cell and Macrophage M2. (B) Macrophage M1, Macrophage M0, Myeloid dendritic cell resting, Macrophage and Myeloid dendritic cell activated. (C) Monocyte, T cell follicular helper, Mast cell resting, Macrophage/Monocyte and Neutrophil. (D) Myeloid dendritic cell, T cell CD4+ memory, T cell CD4+ (non-regulatory), Plasmacytoid dendritic cell and NK cell. (E) T cell CD8+, T cell CD8+ central memory, T cell CD4+ Th1, Uncharacterized cell and T cell regulatory (Tregs).

