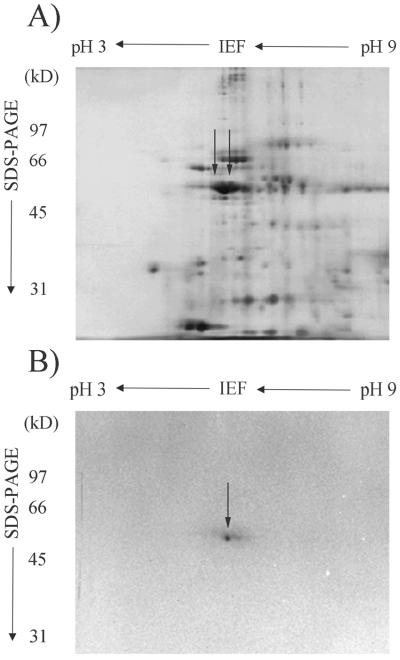
Figure 2.
Two-dimensional gel analysis of crude endomembrane proteins (A) and purified RMP51 (B). Apparent molecular mass of protein standards (kD) are indicated on the left and the pH scale is shown on the top. RMP51 is indicated by solid arrows. Data shown are representative of five independent trials.

