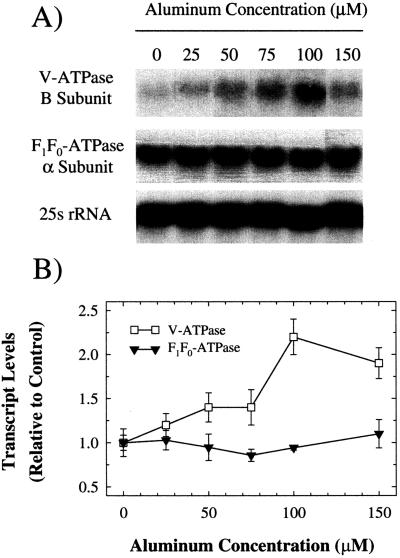
Figure 5.
The effect of Al on transcript levels of V-ATPase and F1F0-ATPase subunits. RNA was isolated from the same tissues used for ATPase activity measurements in Figure 4 and northern blotted. A, Autoradiographs of northern blots probed with 32-P labeled cDNAs encoding the V-ATPase B subunit from barley and the F1F0-ATPase α-subunit from N. plumbaginafolia. To ensure equal RNA loading and transfer, membranes were also probed with a cDNA clone encoding the 25s rRNA from Glycine max. Results shown are representative of three independent trials. B, Quantification of transcript levels shown in A. Transcript levels are expressed as the density of each band relative to 25S rRNA on the autoradiograph. Values are means ± se of three independent replicates.

