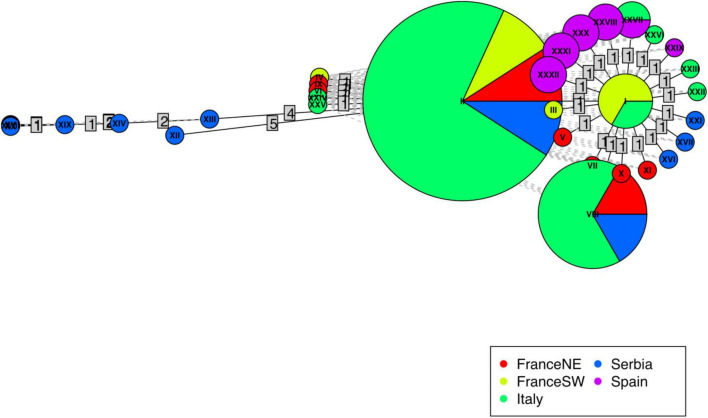
FIGURE 2.
Haplotype network of the 32 Ulmus laevis haplotypes computed using R package “pegas.” Circles are colored according to the provenance of haplotype from different geographic areas. The size of the circles is proportional to the frequencies of each haplotype across all populations. Lines represent the mutational steps between haplotype sequences.

