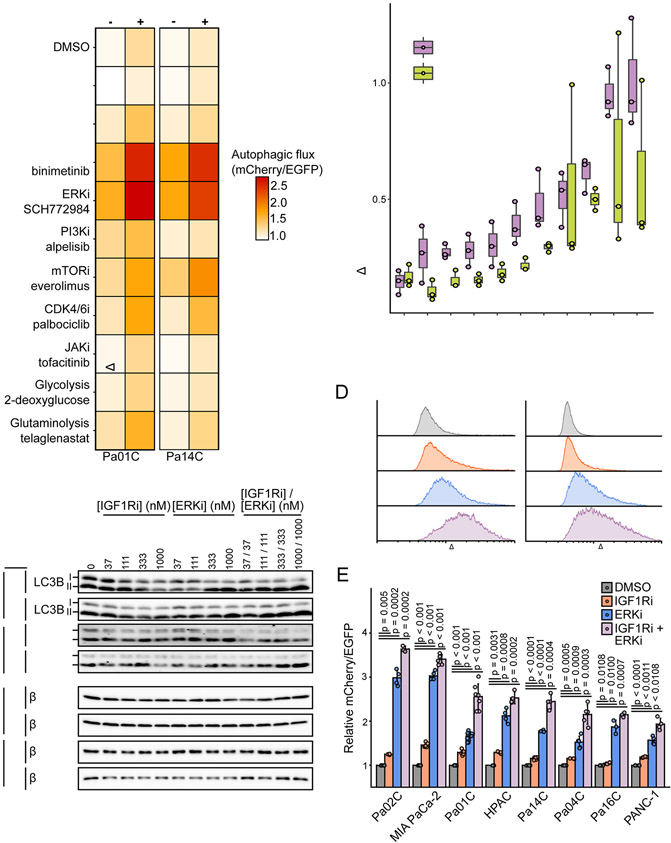
Figure 4.
ERK-MAPK blockade potentiates IGF1Ri induced autophagic flux. A, Median EGFP/mCherry ratios of mCherry-EGFP-LC3B expressing cells analyzed by flow cytometry. Cells were treated for 24 hours with the following inhibitors: SHP2i SHP-099 (10 μM), pan-RAFi lifirafenib/BGB823 (1 μM), MEKi binimetinib (1 μM), ERKi SCH772984 (1 μM), PI3Kαi alpelisib (1 μM), mTORC1i everolimus (100 nM), CDK4/6i palbociclib (500 nM), JAKi tofacitinib (1 μM), phosphoglucose isomerase inhibitor 2-deoxyglucose (5 mM in glucose-free DMEM), glutaminase inhibitor telaglenastat (1 μM). Cells were treated with or without co-treatment with BMS-754807 (IGF1Ri, 500 nM). Data represents the average of three independent experiments. B, Change in median mCherry/EGFP following addition of BMS-754807 (IGFRi, 500 nM) in A is plotted. Boxplots represent three independent experiments. C, Immunoblot analyses of cell lysates from indicated cell lines for LC3B-I/LC3B-II (autophagic flux) and β-tubulin (loading control) treated with BMS-754807 (IGF1Ri), SCH772984 (ERKi), or the combination (24 hours) and then treated with or without bafilomycin A1 (Baf, 200 nM, 2 hours) before lysis. Data are representative of two independent experiments. D, Representative histograms of the ratiometric determination of mCherry/EGFP fluorescence by flow cytometry in mCherry-EGFP-LC3B expressing PDAC cells following treatment with BMS-7754807 (IGF1Ri, 1 μM), SCH-772984 (ERKi, 1 μM), or the combination (24 hours). E, Quantification of median mCherry/EGFP fluorescence as shown in D from four independent experiments.

