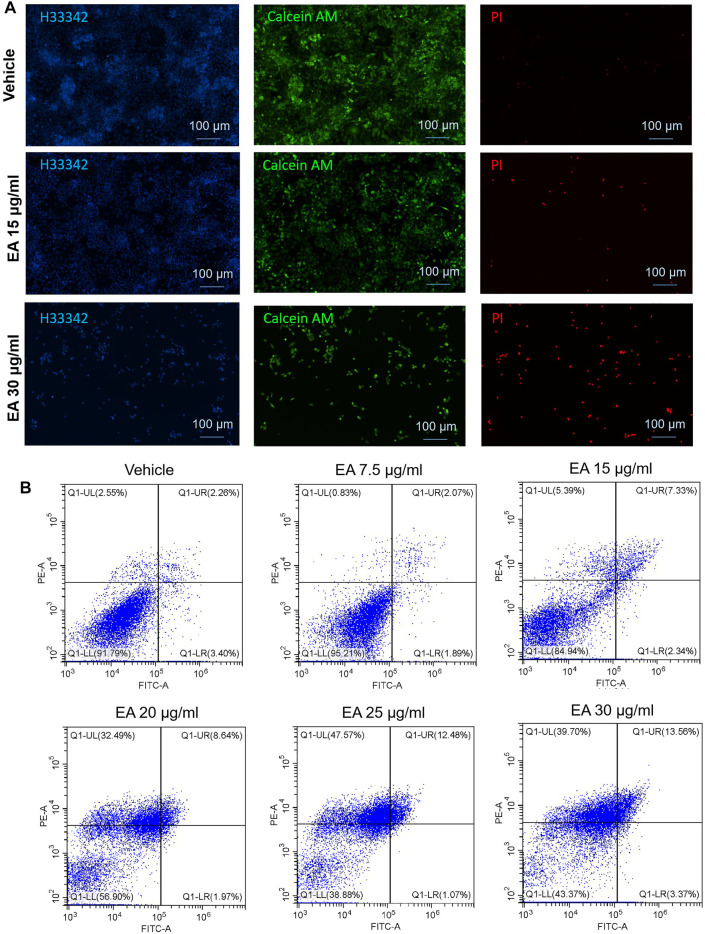
FIGURE 5.
EA induced colorectal cancer cell death via a non-apoptotic manner. (A) Living cells were stained by calcein AM (green fluorescence), dead cells were stained by PI (red fluorescence), and all the cell nuclei were stained by Hoechst33342 (blue fluorescence). (B) PI and Annexin V double stained cells were analyzed by flow cytometry. The X-axis showed the FITC intensity representing the Annexin V on the cell outer membrane, and the Y-axis represented the PI staining intensity of cells. In the four quadrants, Q1-LR represented the early apoptotic cells population, and Q1-UR represented the late apoptotic cells population.

