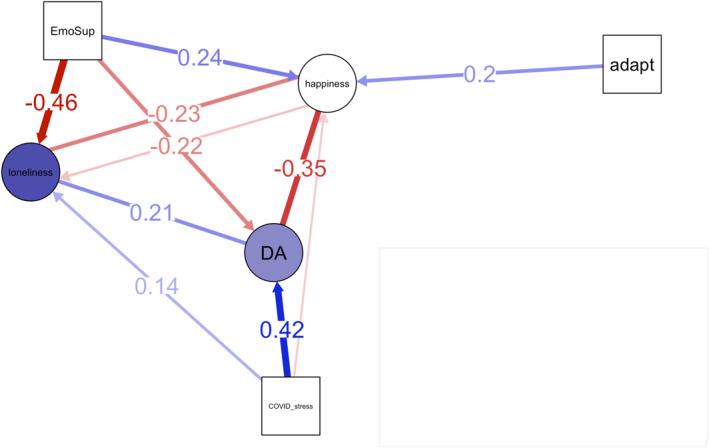
FIGURE 3.

Latent Change Score Model. Circles (nodes) represent latent change scores, and the squares represent predictors of latent change scores. Colored circles, in contrast to white circles, indicate a significant change from T1 to T2. The direction of this effect is indicated through the depth of color. Blue and red colors reflect positive and negative effects, respectively. White colored circular nodes show non‐significant changes. Lines with arrow heads indicate predictive effects while lines without arrow heads visualize correlations between change variables (change correlation parameters). Only lines with significant effects are shown and lines with coefficients smaller than 0.1 have no coefficient displayed. All displayed estimates are standardized. adapt = adaptive coping during COVID‐19; DA = composite of the change in depression + generalized anxiety; EmoSup = emotional support during COVID‐19
