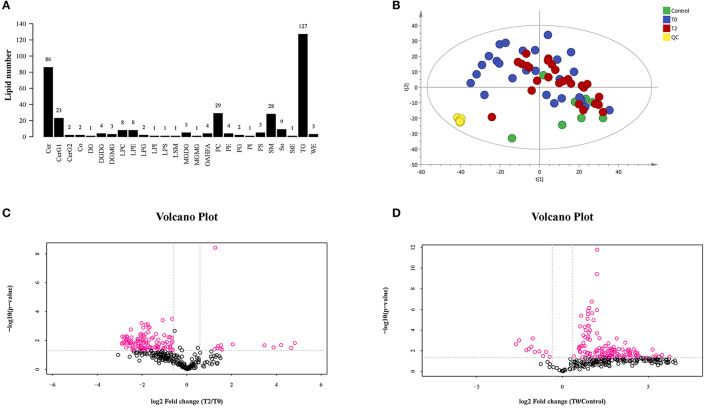
Figure 2.
The LC-MS/MS analysis of human meibum in normal control (n = 10), before the first treatment of IPL (T0, n = 26) and the third treatment (T2, n = 26). (A) The identification of the lipid species. (B) PCA diagram among T0 group, T2 group, control group, and QC group. There was a significant trend distinction between T0 and control groups. (C,D), respectively). The volcano plot of the lipids' quality of T2 vs. T0 (C) and T0 vs. control (D).

