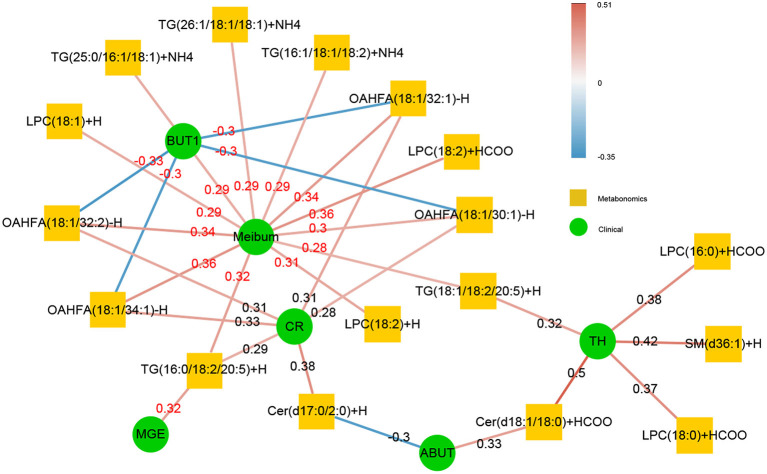
Figure 5.
The correlation of significant subclasses of lipids with the clinical syndrome. The change in the lipid metabolic was highly related to the improvement in the clinical index. The correlation was rich in TBUT, CR, and meibum quality, and some lipids were crossrelated to them. The green in the middle represents the clinical index data, and the orange in the outer circle is the differential metabolic lipid. The darker the color of the line was, the stronger the correlation was, and the number on the line was the r-value of its correlation coefficient. The red line indicated that there was a positive correlation between the two, whereas the blue line represented a negative correlation between the two.

