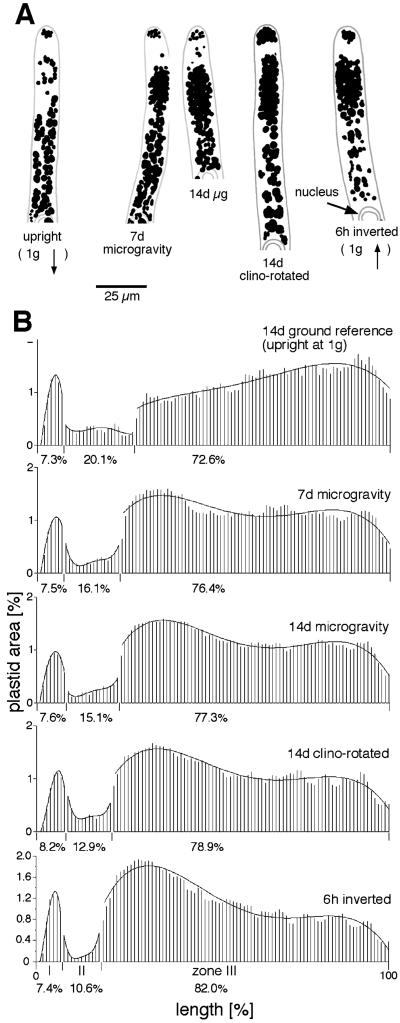
Figure 3.
Distribution of plastid area in stationary, rotated, and space-grown cells. A, Tracings from micrographs in Figure 2. Scale bar = 25 μm. B, Each bar shows the percentage of total plastid area found in each sector. Values are means for 19 to 34 apical cells for each treatment. The data were normalized for the distance between the cell tip and the center of the nucleus by dividing this distance into 100 sectors. The percentages below each abscissa are the relative plastid areas in zones I to III, respectively. The curves were derived from polynomials expressed to the fourth degree. Note the greater plastid area at the apical part of zone III in space-grown and clino-rotated cells and the opposite curves of upright compared with inverted cells.

