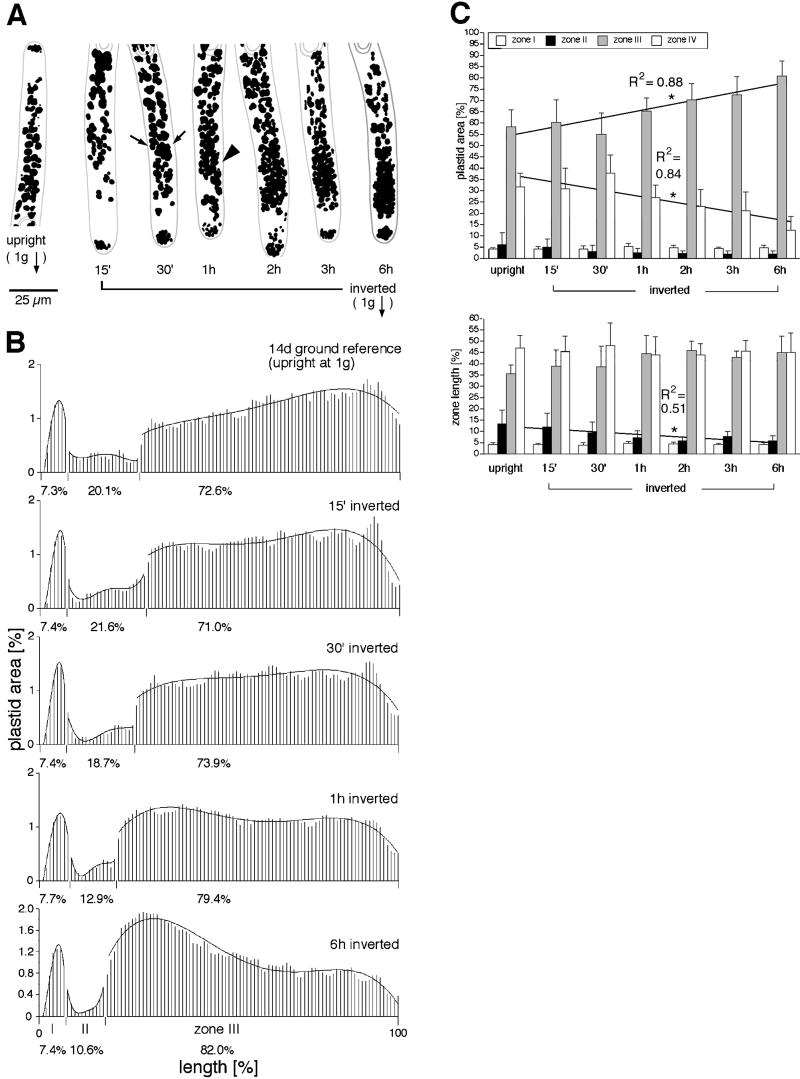
Figure 6.
Time course of plastid sedimentation following inversion. A, Tracings of representative cells. Scale bar = 25 μm. Sedimentation can be detected after 30 min (arrows), and a higher concentration of plastids in the apical end of zone III can be seen as early as 1 h (arrowhead). B, Histograms of plastid area using methods described in the legend to Figure 3; n = 19 to 24 cells for each time point. C, Plastid area increases in zone III and decreases in zone IV (R2 values of linear regressions shown). Neither zone changes in length over time.

