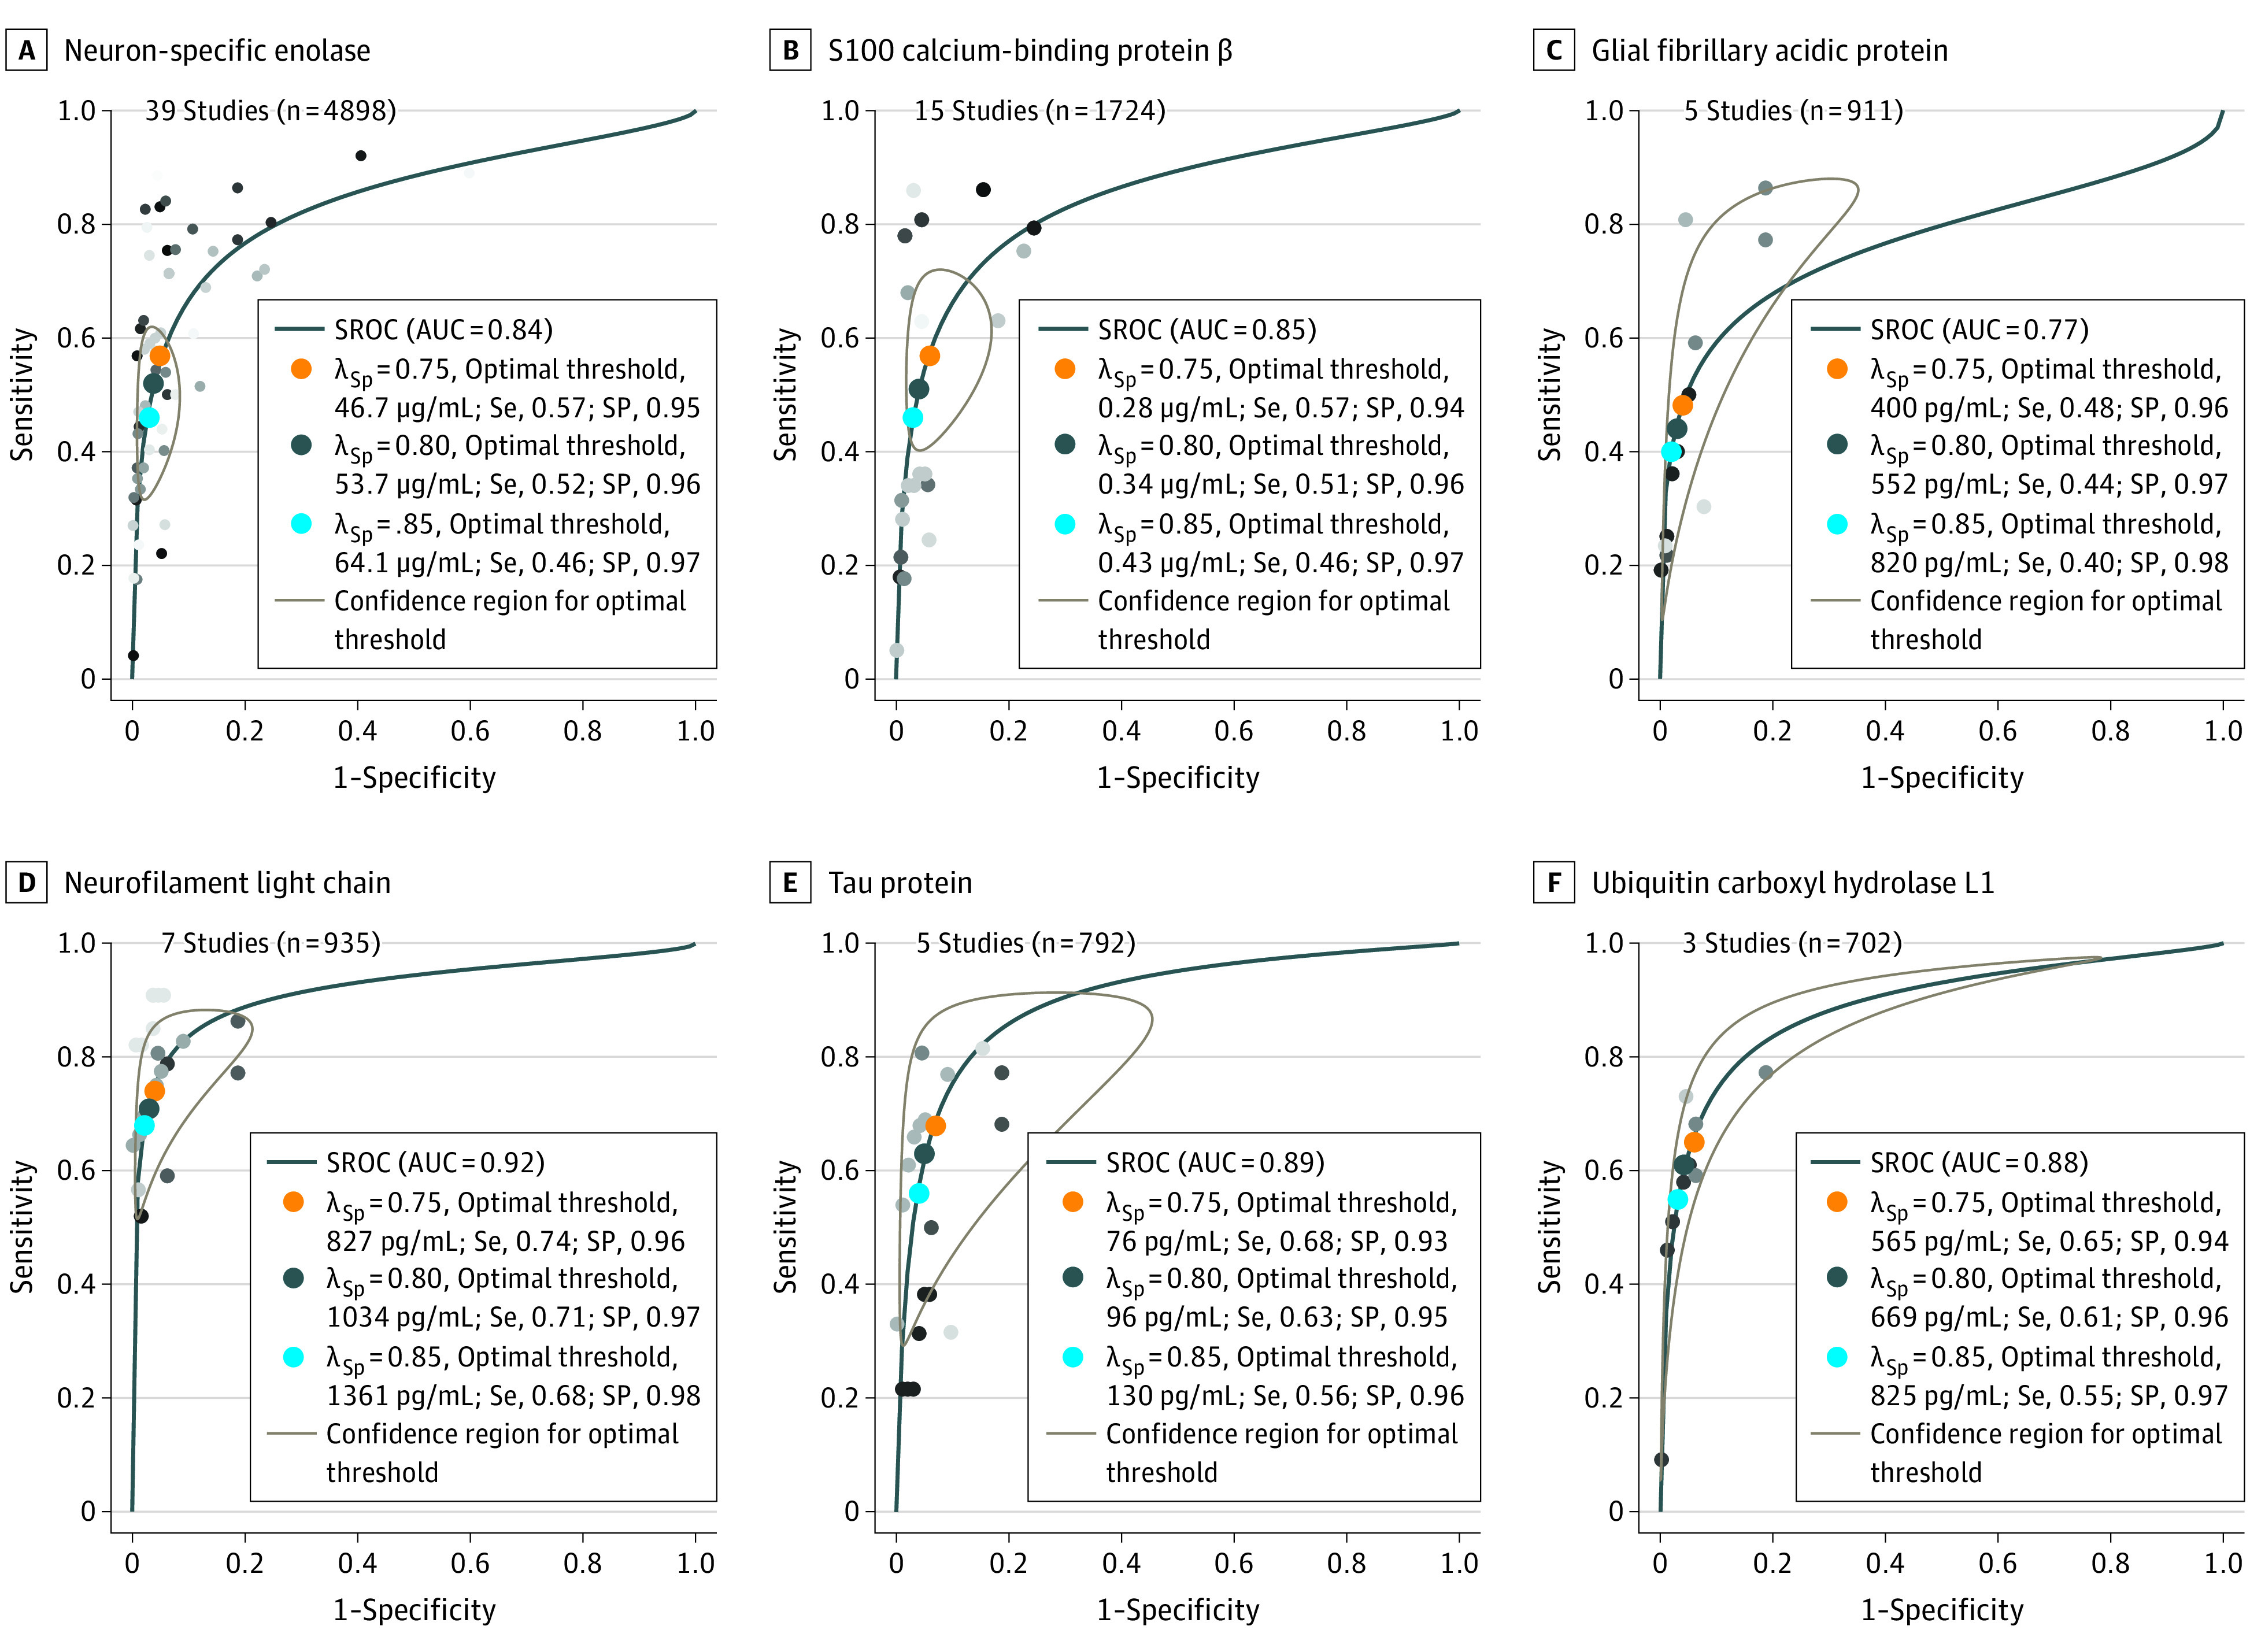
Figure 2. Receiver Operating Characteristic Curves for the Diagnostic Accuracy of Brain Biomarkers for Predicting Unfavorable Outcome.

Summary receiver operating characteristic (SROC) curves and their confidence intervals for each biomarker at 48 hours following return of spontaneous circulation are presented. Each individual dot represents a unique study. We estimated optimal thresholds for each biomarker for particular weights of specificity. We weighted specificity at 75% (orange dots), 80% (gray dots), and 85% (blue dots) with sensitivity weighted 25%, 20%, and 15%, respectively. For each weight of specificity, an optimal threshold on the SROC curve was calculated and is reported in the figure for each variable. The SROC area under the curve for each biomarker are neuron-specific enolase, 0.84 (95% CI, 0.77-0.91); S100 calcium binding protein β, 0.85 (95% CI, 0.76-0.92); glial fibrillary acidic protein, 0.77 (95% CI, 0.59-0.91); neurofilament light chain, 0.92 (95% CI, 0.84-0.97); tau, 0.89 (95% CI, 0.71-0.97); and ubiquitin carboxyl hydrolase L1, 0.88 (95% CI, 0.52-0.99). Concentration threshold and corresponding sensitivity to achieve 95% and 100% specificity for each biomarker are presented in eTable 3 in the Supplement. λSp indicates the weighting of specificity at either 75%, 80%, or 85% (see statistical analysis for details); AUC, area under the curve; Se, sensitivity; SP, specificity.
