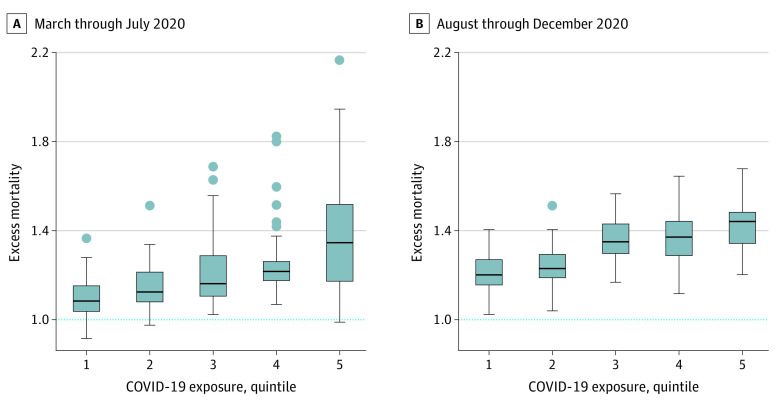
Figure 2. Variation in Excess Mortality Among Enrollees With Alzheimer Disease and Related Dementias (ADRD) by COVID-19 Quintile in March Through July (First Wave) and in August Through December (Second Wave) 2020.
Box and whisker plots showing the wide variation in ADRD excess mortality across hospital referral regions, even in regions with similar levels of community infection. To reduce statistical noise, hospital referral regions are limited to those with at least 5000 beneficiaries with ADRD in 2019 and 2020. Variability is highest in the first wave of the pandemic, with the Bronx, New York (excess mortality, 2.17), Newark, New Jersey (1.95), and Ridgewood, New Jersey (1.91), exhibiting the highest rates in the ADRD population. The x-axis represents quintiles of COVID-19 infection rates. The lower border of the box represents the 25th percentile; the upper border, the 75th percentile. The lower and upper ends of the whiskers represent minimum and maximum rates for each quintile; dots represent outliers.

