
Figure 1. Horizontal cell reconstruction from electron microscopy data.
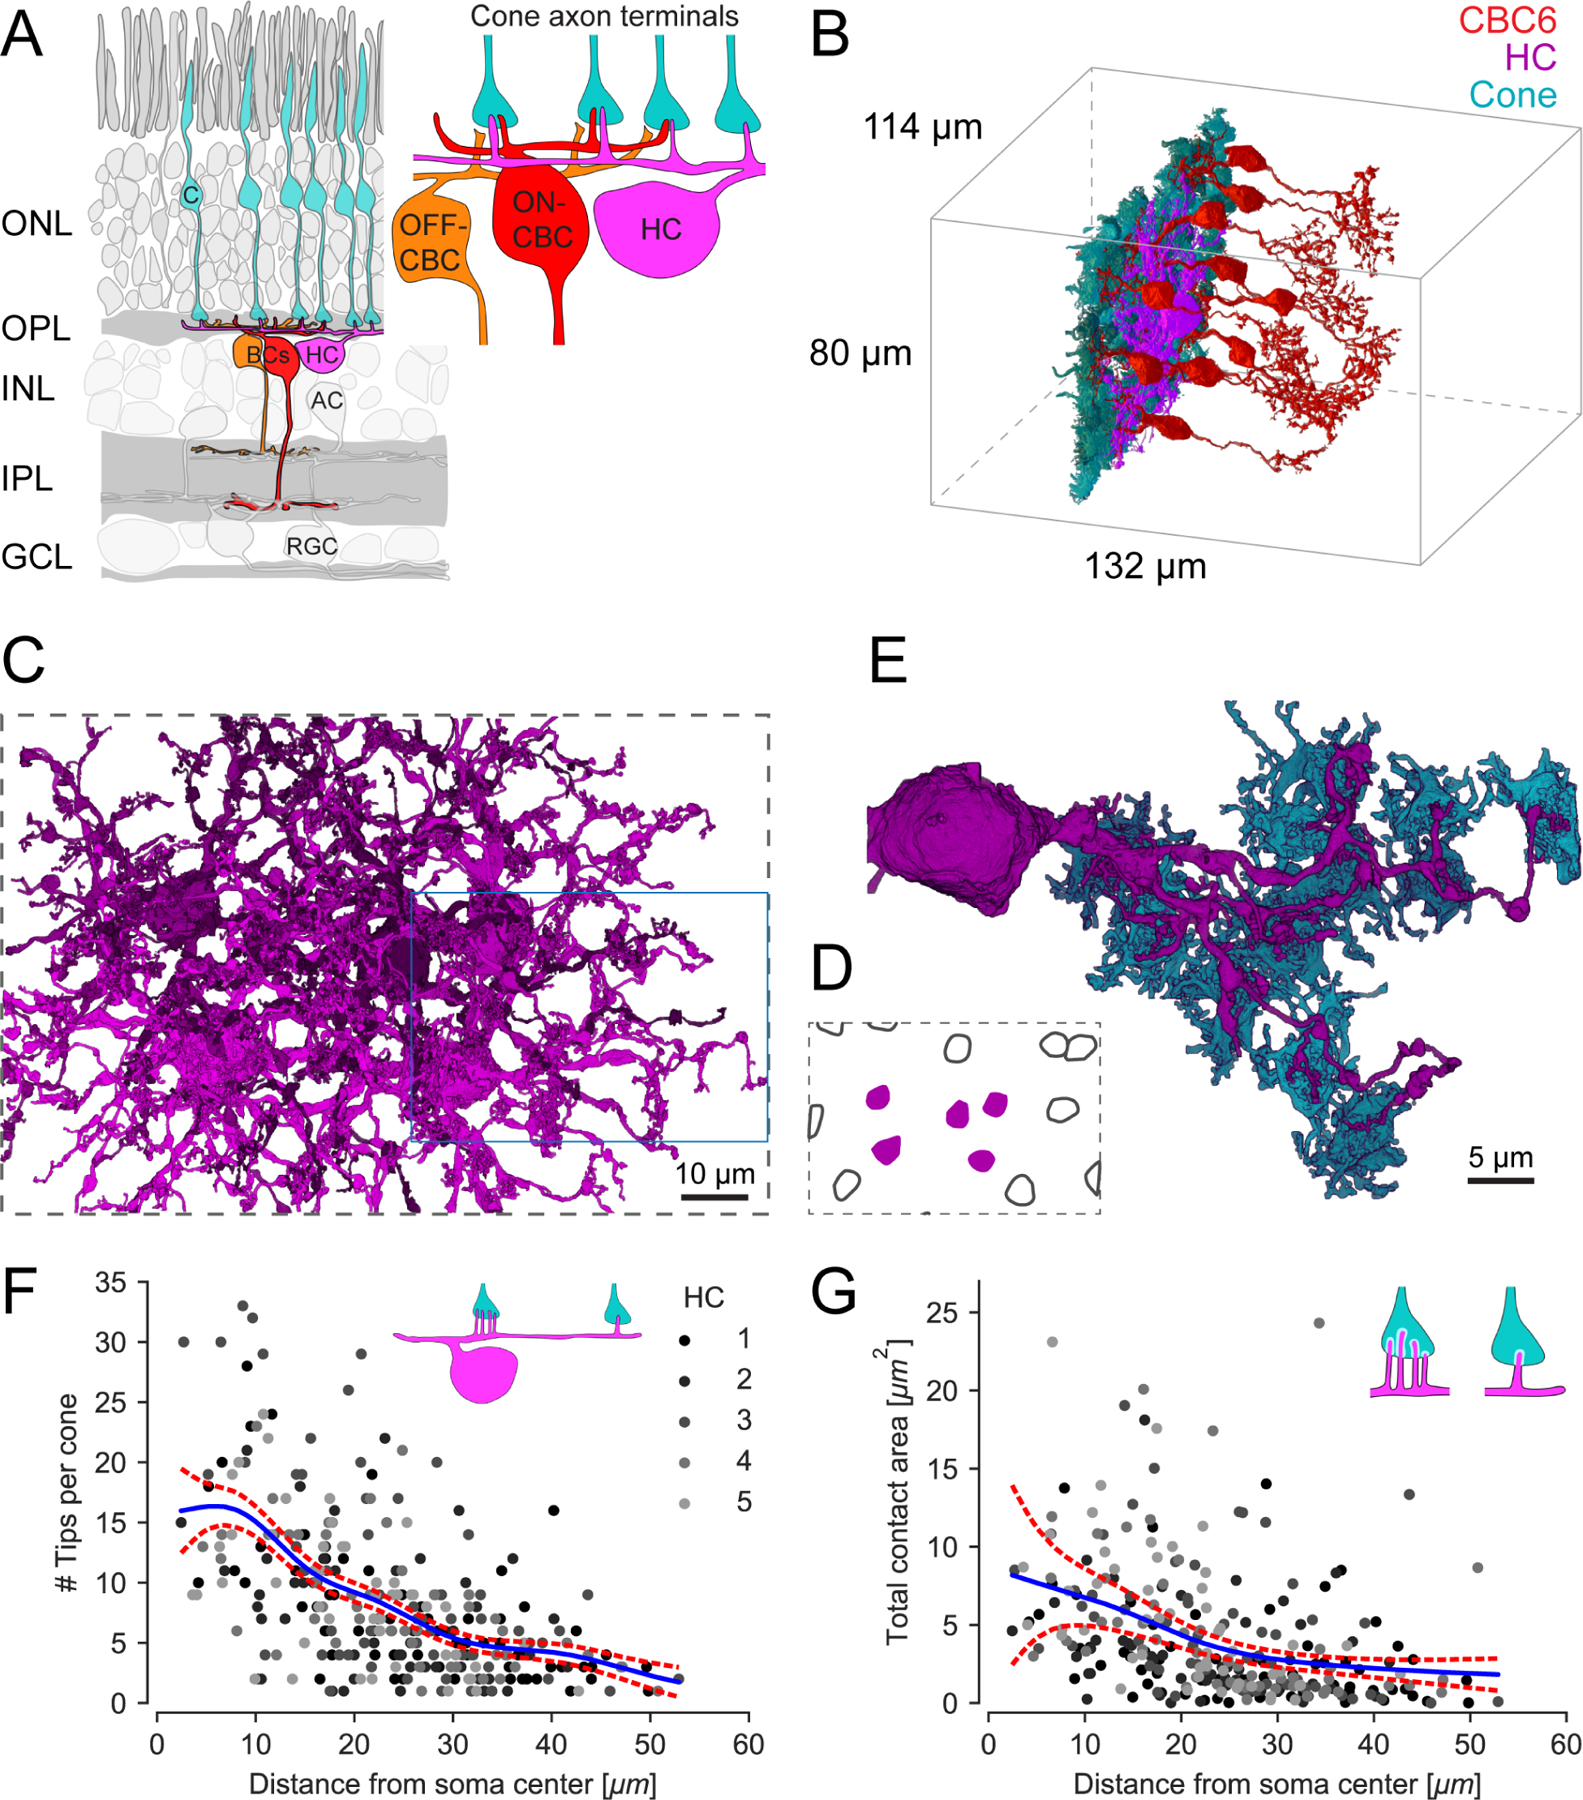
(A) Schematic of a vertical section through the mouse retina, highlighting the reconstructed cell types. Inset: Textbook-view of the connectivity of bipolar cells (BCs) and horizontal cell (HC) at the cone (C) axon terminals with invaginating HC (magenta) and ON-CBC (red) dendritic tips and basal OFF-CBC contacts (orange). AC, amacrine cell; RGC, retinal ganglion cell. (B) Outlines of the dataset with volume reconstructed cone axon terminals (cyan), one HC (magenta) and several CBC type 6 (CBC6, red; only 10 of 45 CBC type 6 shown). (C) Volume reconstructions of five HCs (top view); blue rectangle: location of dendrite shown in (E). For renderings of the individual cells see Figure S1. (D) Soma locations of the five reconstructed HCs (magenta, shown in C) and 10 HCs not reconstructed (black outline). (E) Bottom view of the volume reconstruction of a complete single HC primary dendrite (magenta) with contacted cone axon terminals (cyan). HC dendrite taken from inset in (C). (F) HC skeleton tips per contacted cone vs. distance from HC soma. Blue: Poisson GAM fit with 95%-confidence interval (red). Inset illustrates the number of HC tip-to-cone contacts at different locations along the HC dendrite. See Figure S2 for an example EM slice and HC branch skeleton. (G) Contact area between HC and cone axon terminal volume reconstructions per cone vs. distance from HC soma. Blue: Gamma GAM fit with 95%-confidence interval (red). Inset illustrates contact areas (white) for close-to-the-soma contacts (left) and more distant (right) contacts. For contact statistics between cones and ON-CBCs see Figure S3.