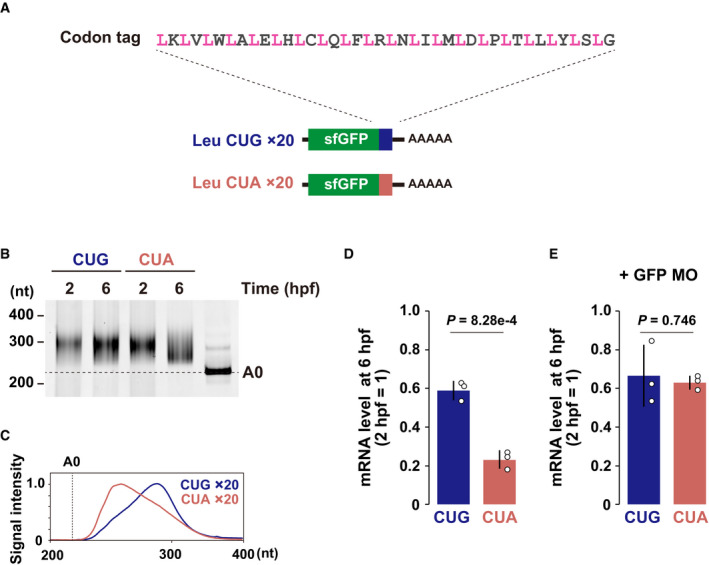
Figure 1. Development of a codon‐tag reporter system.

-
AA scheme of the codon‐tag reporter system. A codon to be tested (pink, in this case leucine) and 1 of the 20 sense codons (gray) are alternately repeated 20 times. This codon‐tag sequence was inserted at the end of the sfGFP ORF.
-
BPoly(A) tail analysis of codon‐tag reporter mRNAs at 2 and 6 hpf. The developmental stages are shown above. The lane labeled A0 shows the 3´ UTR fragment without a poly(A) tail.
-
CQuantification of the PAT assay at 6 hpf in (B).
-
D, EqRT–PCR analysis of codon‐tag reporter mRNA levels at 6 hpf relative to 2 hpf in the absence (D) or the presence (E) of translation‐blocking GFP MO. Bar charts show the average of three independent biological replicates. Error bars show standard deviation (SD). Individual data points are shown as dots. P‐values were calculated using two‐sided Student’s t‐test.
Source data are available online for this figure.
