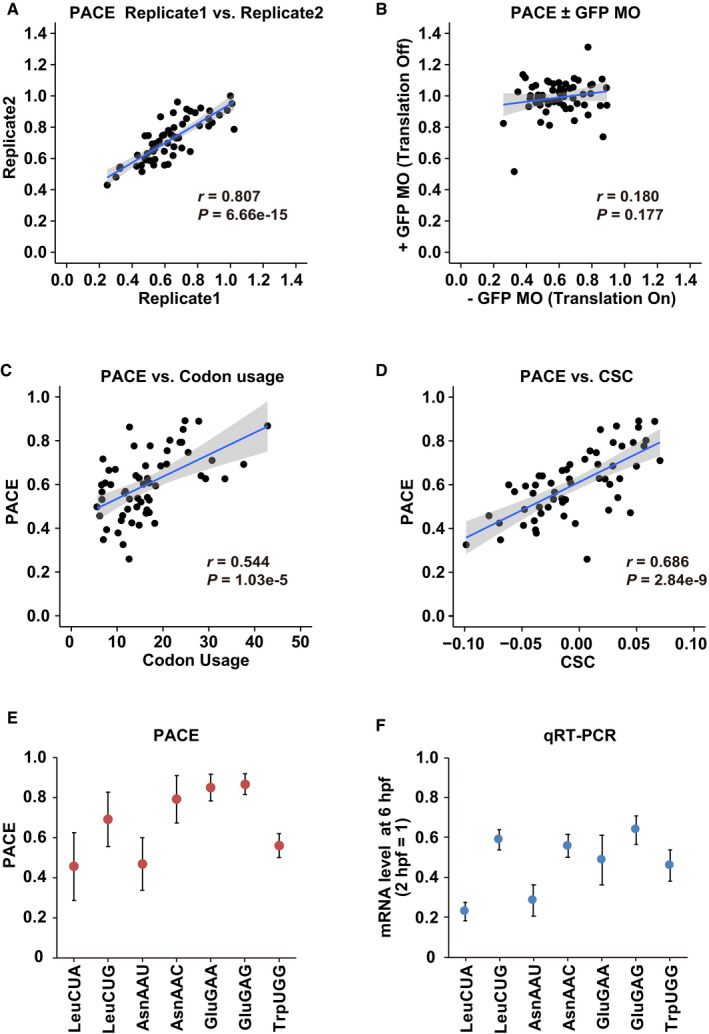
Figure EV1. Validation of PACE.

-
AA scatter plot showing the reproducibility of the codon effects measured by PACE in two replicates.
-
BA scatter plot comparing the codon effects measured by PACE in the absence (x‐axis) and in the presence of GFP MO (y‐axis).
-
CA scatter plot comparing codon usage in the zebrafish genome (per thousand codons, x‐axis) and the codon effects measured by PACE (y‐axis).
-
DA scatter plot comparing CSCs (Bazzini et al, 2016, x‐axis) and the codon effects measured by PACE (y‐axis).
-
E, FComparison of the codon effects measured by PACE (E) with the results of qRT–PCR (F). mRNA levels at 6 hpf relative to 2 hpf are shown. The experiments were repeated three times. Error bars show SD.
Data information: In (A–D), the regression line is shown in blue and the 95% confidence interval is shown in gray. r represents Pearson's correlation. The significance was calculated using Student’s t‐test.
Source data are available online for this figure.
