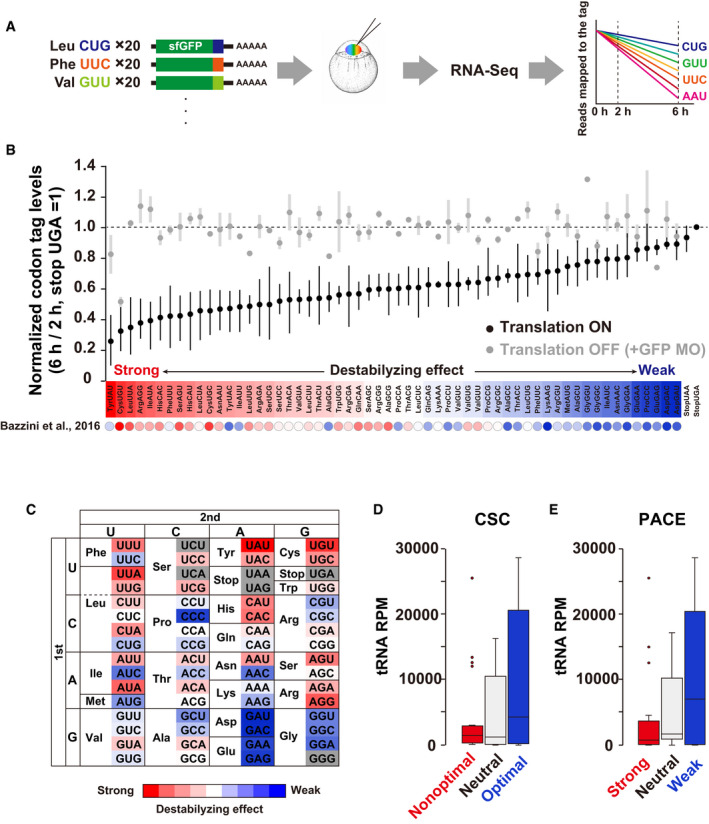
Figure 2. Parallel analysis of codon effects (PACE) in zebrafish embryos.

- Scheme of parallel analysis of codon effects (PACE). Codon‐tag reporter mRNAs were pooled as a library and co‐injected into fertilized zebrafish eggs. Embryos were collected at 2 and 6 hpf and subjected to RNA‐Seq analysis. Reads mapped on each codon‐tag region were quantified to calculate each codon’s effect on mRNA stability.
- Results of PACE in zebrafish embryos. Black circles show the relative stability of reporter mRNAs under normal translation (averages of three biological replicates). The stability of a codon‐tag reporter with a UGA stop codon was set to one. Gray circles show the relative stability of reporter mRNAs under the condition in which translation initiation was inhibited by GFP MO (averages of two biological replicates). Error bars represent max and minimum data points. The relative effect of each codon on mRNA stability is shown as a color gradient from red (destabilizing) to blue (stabilizing). CSCs in Bazzini et al, 2016 are also indicated below as circles with the same color gradient.
- PACE results shown in (B) are presented as a codon table.
- Box plot of tRNA amounts for nonoptimal (red, 20 codons), neutral (light gray, 18 codons), and optimal (blue, 20 codons) codons based on CSCs (Bazzini et al, 2016).
- Box plot of tRNA levels for codons with strong (red, 20 codons), neutral (light gray, 18 codons), and weak (blue, 20 codons) destabilizing effects based on PACE.
Data information: In (D) and (E), the box represents the interquartile range (IQR), with the median indicated as a black horizontal line in the box. The whiskers represent the variation within 1.5 IQR outside the upper and lower quartiles. Outliers are shown as dots. RPM, reads per million mapped reads.
Source data are available online for this figure.
