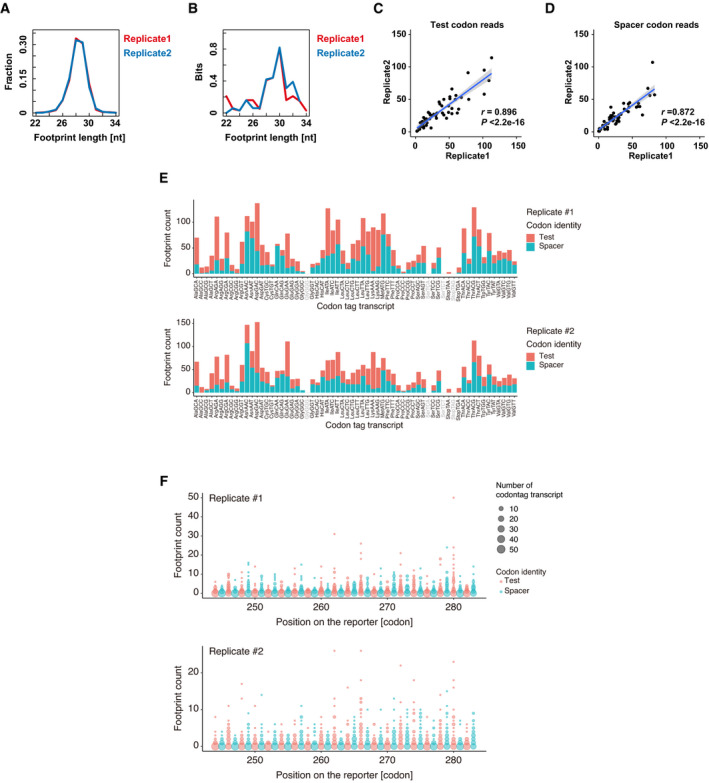
Figure EV2. Validation of ribosome footprint analysis.

-
ADistribution of the ribosome footprint lengths derived from codon‐tag sequences. The results of the two replicates are plotted separately in red and blue.
-
BEvaluation of the codon periodicity by calculating the relative entropy of information content (Kullback–Leibler divergence) of each reading frame using ribosome footprints aligned to the codon‐tag reporter sequences. In this analysis, higher bits indicate the presence of periodicity in a particular reading frame. The results of the two replicates are plotted separately in red and blue.
-
C, DScatter plots showing the reproducibility of ribosome footprint analysis using PACE reporters. Two replicates for test codon reads (C) and spacer codon reads (D) are shown. The regression line is shown in blue and the 95% confidence interval is shown in gray. r, Pearson's correlation. Significance was calculated by Student’s t‐test.
-
ENumbers of ribosome footprints with a test codon (pink) or a spacer codon (turquoise) in the corresponding A‐site position are shown for each codon‐tag transcript. The results of the two replicates are plotted separately.
-
FDistributions of the ribosome footprints along the codon‐tag sequences. The size of the circles indicates the number of codon‐tag transcripts that generated footprints at each codon‐tag position. The y‐axis indicates the number of counted footprints. The results of the two replicates are plotted separately.
Source data are available online for this figure.
