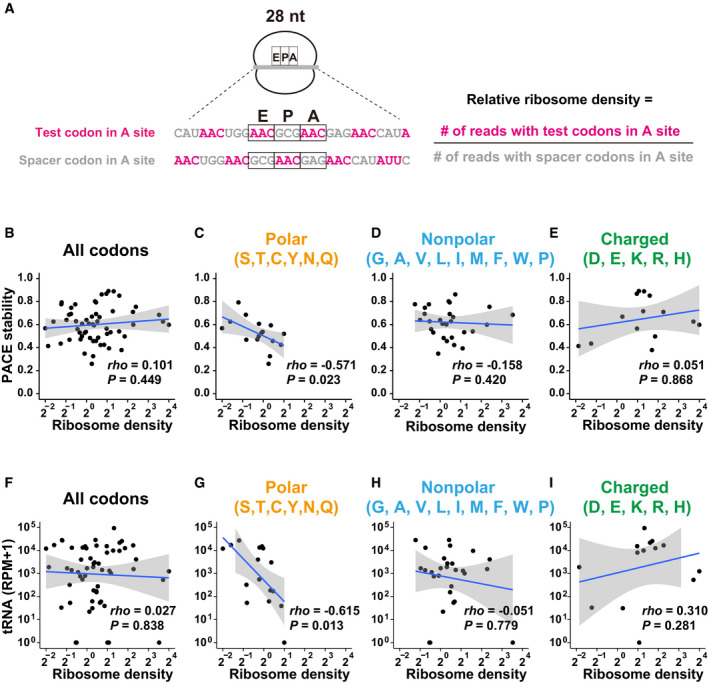
Figure 3. Analysis of the ribosome decoding speed at codon‐tag sequences.

-
AScheme of ribosome footprint analysis using PACE reporter mRNAs. An example of a 28‐nt footprint is shown. The relative ribosome density of each codon at the A site was calculated using the formula shown on the right.
-
B–EScatter plots showing a correlation between relative ribosome density (28–30‐nt footprints; x‐axis) and the codon effects measured by PACE (y‐axis). Each dot represents a single codon. Graphs for all codons (B), codons for polar amino acids (C), nonpolar amino acids (D), and charged amino acids (E) are shown.
-
F–IScatter plots showing a correlation between relative ribosome density (28–30‐nt footprints; x‐axis) and the tRNA levels (y‐axis, Bazzini et al, 2016). Each dot represents a single codon. Graphs for all codons (F), codons for polar amino acids (G), nonpolar amino acids (H), and charged amino acids (I) are shown. RPM, reads per million mapped reads.
Data information: In (B–I), the regression line is shown in blue and the 95% confidence interval is shown in gray. P‐values were calculated using Student’s t‐test. rho, Spearman's correlation.
Source data are available online for this figure.
