
Figure EV4. Validation of MZznf598 mutant.
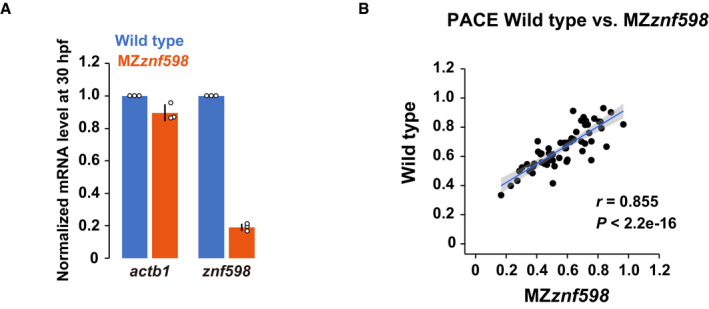
- qRT–PCR analysis of actb1 and znf598 mRNA levels in wild‐type and MZznf598 embryos at 24 hpf. The results are normalized to 18S rRNA levels. The mRNA levels in wild type were set to one. The experiments were repeated three times. Error bars show SD. Individual data points are shown as dots.
- A scatter plot comparing the codon effects measured by PACE in MZznf598 (x‐axis) and wild‐type (y‐axis) embryos. The regression line is shown in blue, and the 95% confidence interval is shown in gray. r, Pearson's correlation. Significance was calculated by Student’s t‐test.
Source data are available online for this figure.