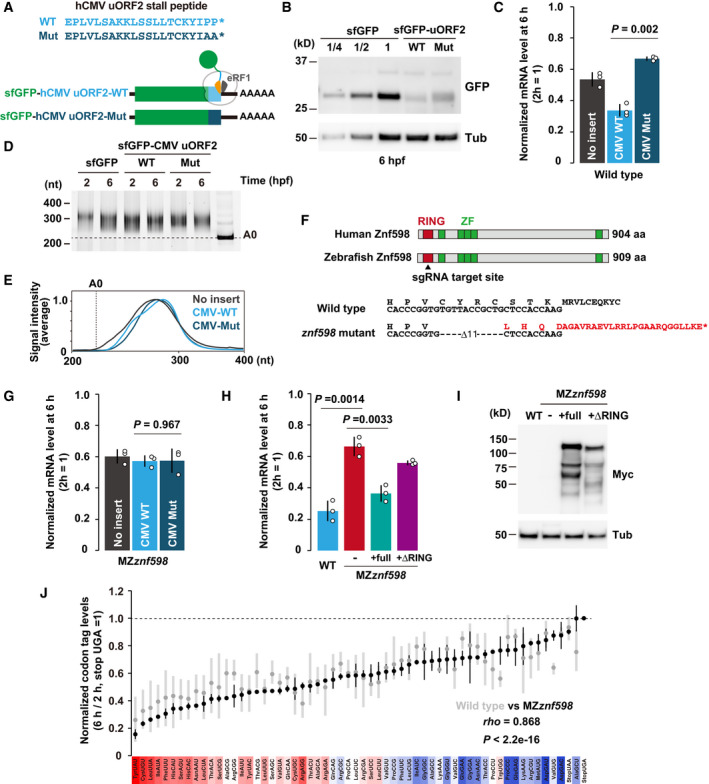
Figure 5. The effect of ribosome stalling on mRNA stability.

- A scheme of the hCMV uORF2 reporter mRNAs. Wild‐type hCMV uORF2 (light blue) or its mutant (dark blue) was inserted at the end of the sfGFP ORF. Asterisks indicate stop codons.
- Western blotting to detect the sfGFP levels at 6 hpf. Tubulin (Tub) was detected as a loading control.
- qRT–PCR analysis of hCMV uORF2 reporter mRNA levels in wild‐type embryos at 6 hpf relative to 2 hpf.
- Poly(A) tail analysis of hCMV uORF2 reporter mRNAs at 2 and 6 hpf. The developmental stages are shown above as hpf. The lane labeled A0 shows the 3´ UTR fragment without a poly(A) tail.
- Quantification of the PAT assay at 6 hpf in (D).
- Scheme of human and zebrafish Znf598 proteins. The sgRNA target site is indicated by an arrowhead. Genome sequences of wild‐type and znf598 mutant zebrafish are shown below. The predicted amino acid sequence of mutated Znf598 is shown in red. The asterisk indicates the premature stop codon.
- qRT–PCR analysis of hCMV uORF2 reporter mRNA levels in MZznf598 embryos at 6 hpf relative to 2 hpf.
- qRT–PCR analysis of hCMV uORF2 reporter mRNA levels in wild‐type embryos, MZznf598 embryos and MZznf598 embryos injected with a mRNA encoding Myc‐tagged full‐length (full) or RING domain‐deleted (ΔRING) Znf598. mRNA levels at 6 hpf relative to 2 hpf are shown.
- Western blotting to detect the Myc‐tagged Znf598 proteins at 6 hpf. Tubulin (Tub) was detected as a loading control.
- Results of PACE in MZznf598 zebrafish embryos. Black circles show the relative stability of the reporter mRNAs (averages of two biological replicates) in MZznf598 embryos. Gray circles show the relative stability of reporter mRNAs in wild‐type embryos shown in Fig 2B. The stability of a codon‐tag reporter with a UGA stop codon was set to one. Error bars represent maximum and minimum data points. The relative effect of each codon on mRNA stability in wild‐type embryos measured in Fig 2B is shown as a color gradient from red (destabilizing) to blue (stabilizing). rho, Spearman's correlation. Significance was calculated by Student’s t‐test.
Data information: In (C), (G), and (H), bar charts show the average of three independent biological replicates. Error bars show SD. Individual data points are shown as dots. P‐values were calculated using two‐sided Student’s t‐test.
Source data are available online for this figure.
