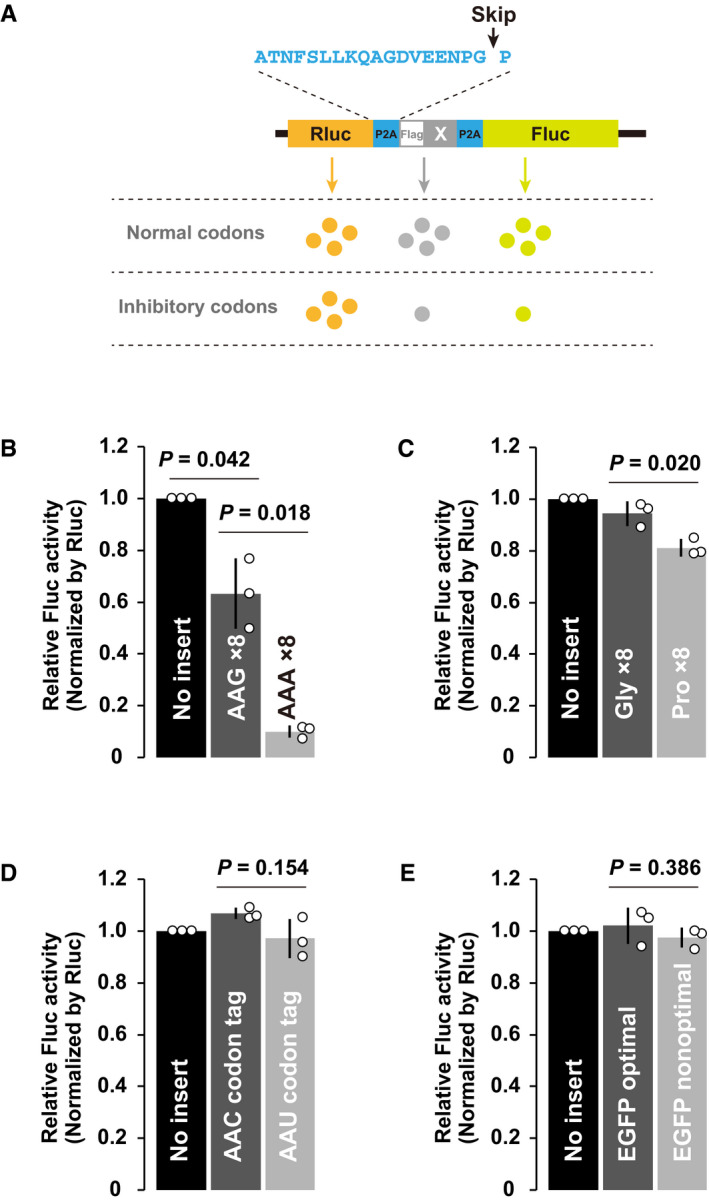
Figure 6. Analysis of the translation elongation rate in zebrafish embryos.

- A schematic of the tandem ORF assay. The Rluc ORF (orange) and Fluc ORF (light green) are separated by two P2A translation skipping sequences (light blue). A sequence to be tested (shown as X in gray) is inserted between the two P2A sequences.
- Results of the tandem ORF assay with Lys AAG×8 and Lys AAA×8 sequences.
- Results of the tandem ORF assay with Gly×8 and Pro×8 sequences.
- Results of the tandem ORF assay with Asn AAC and Asn AAU codon tags.
- Results of the tandem ORF assay using EGFP ORFs with different codon optimalities.
Data information: In (B–E), normalized Fluc activity with no insert was set to one. All experiments were repeated three times, and the average Fluc activity is shown as bar charts. Error bars show SD. Individual data points are shown as dots. P‐values were calculated using two‐sided Student’s t‐test.
Source data are available online for this figure.
