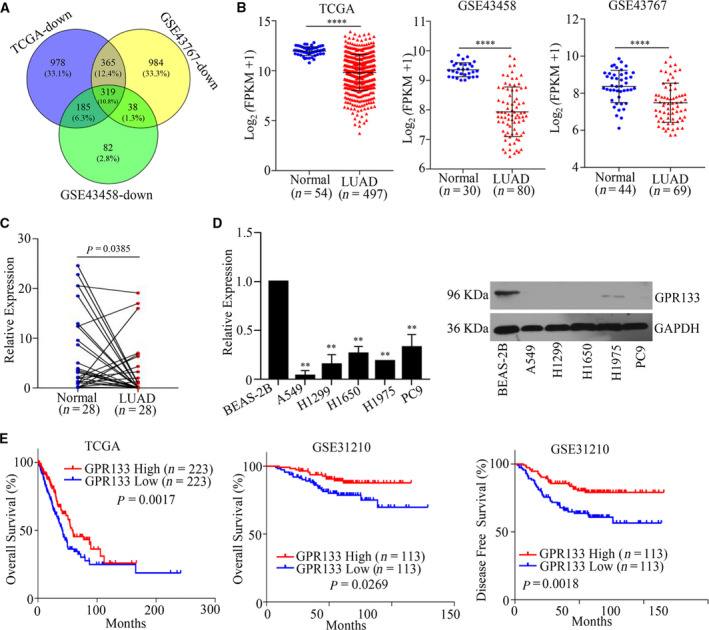
Fig. 1.

The expression pattern of GPR133 in LUAD. (A) Gene expression information was downloaded from TCGA and GEO databases, and a Venn diagram was used to identify differentially expressed genes. (B) The expression pattern of GPR133 in LUAD was displayed in TCGA and GEO databases vs. normal, ****P < 0.0001. (C) Total RNAs were obtained from 28 samples of LUAD tissue and matched adjacent normal tissues, and qRT‐PCR assays were implemented to detect GPR133 expression in these tissues. Data were reported as mean ± standard deviation (SD) for three independent experiments, and statistical analysis was performed via Student’s t‐test. (D) The mRNA and protein expression levels of GPR133 in LUAD cells were measured by qRT‐PCR and western blot assays, respectively. Data were reported as mean ± SD for three independent experiments, and statistical analysis was performed via Student’s t‐test vs. BEAS‐2B, **P < 0.01. (E) Kaplan–Meier analysis was conducted according to GPR133 expression in patients with LUAD from TCGA database and GSE31210 dataset.
