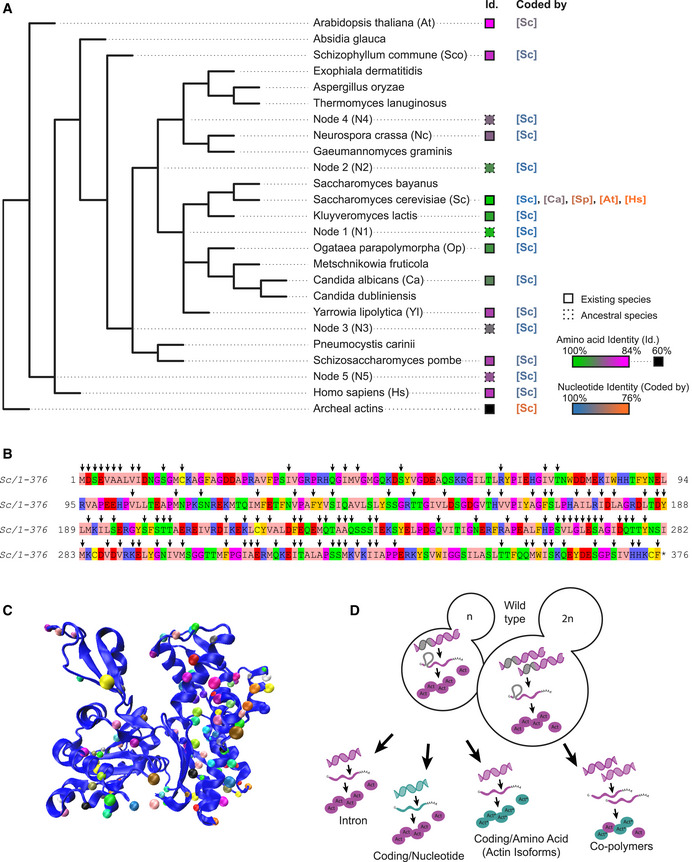
Figure 1. Variety of actins selected for this study and analysis strategies.

- Simplified phylogenetic tree showing mainly the Dikarya subkingdom and including the external branches Homo sapiens (Hs) and Arabidopsis thaliana (At). The Id. column indicates amino acid sequences percentage identities, ranging from 100% (green) to 84% (magenta) identity for eukaryotic actins to S. cerevisiae’s actin, and 60–62% (black) for archaeal actins. Squares’ outlines are solid or dotted for sequences deriving from existing species or ancestral reconstruction, respectively. The “coded by” column indicates, which coding sequences were originally used to code genes of interest. Nucleotide sequence identities are ranging from 100% (blue) to 76% (orange) compared to S. cerevisiae’s actin coding sequence.
- Amino acid sequence of Saccharomyces cerevisiae actin. Arrows denote all the positions that are mutated in at least one of the actin variants tested in this study.
- Schematic representation of S. cerevisiae actin 3D structure (1YAG; Vorobiev et al, 2003), showing that mutations cover all regions of the protein. Dots indicate where mutations are located, using a different color code for all actins studied here.
- Schematic showing the mutagenesis strategies applied in this study, enabling to question respectively the importance of actin’s intron, the nucleotide sequence, the amino acid sequence, and the effect of expressing copolymers. Green color indicates whether modifications are brought in the coding sequence (leading to expression of wild‐type Act1 protein (pink) or in the amino acid sequence (leading to expression of an Act1* actin ortholog).
