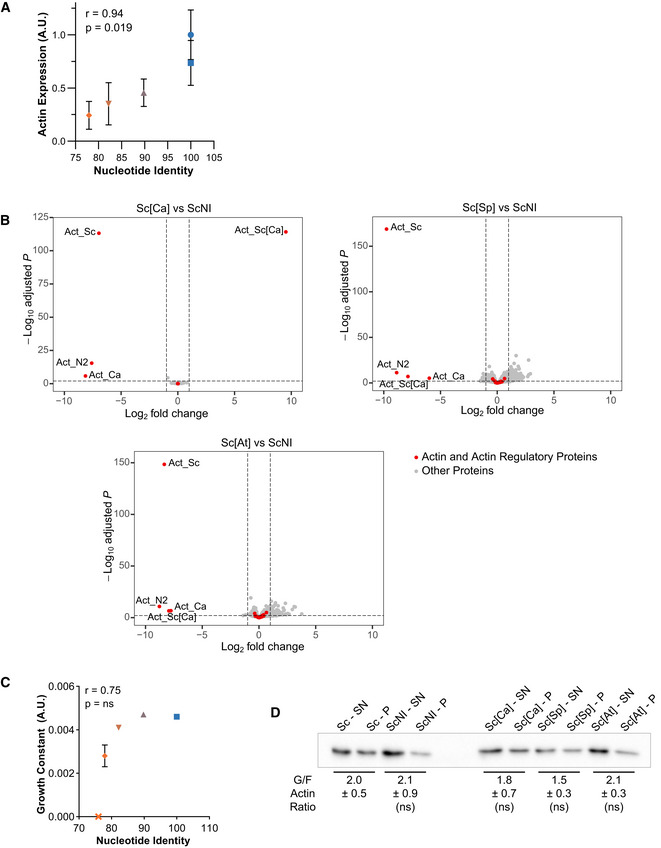
In this expanded view figure, the shape of the dots is conserved from Fig
2 and allows to identify the strains on the different graphs (circles for Sc, squares for ScNI, triangles for Sc[Ca], inversed triangles for Sc[Sp], diamonds for Sc[At] and crosses for nonviable strains). The color of the dots indicates the percentage of identity of the nucleotide sequences to the actin gene of
S. cerevisiae, ranging from 100% (blue) to 75% (orange).
Actin expression levels, relative to wild‐type, as a function of nucleotide conservation, showing that increased number of silent mutations lowers actin expression. Data are presented as mean ± SD (n = 4 for Sc, n = 8 for ScNI; n = 12 for Sc[Ca], Sc[Sp] and Sc[At]; 2 biological replicates with n/2 technical replicates each). Pearson correlation coefficient r is considered nonsignificant if P > 0.05.
Differential gene expression of Sc[Ca], Sc[Sp] and Sc[At] strains compared to ScNI strain. Y‐axis represents the adjusted P‐value of FDR (False Discovery Rate) calculated with Benjamini and Hochberg method, and X‐axis fold‐changes. Red dots highlight proteins of interest (actin and 32 regulatory proteins) and grey dots represent all the other proteins identified by RNA‐seq.
Growth constant as a function of nucleotide identity, showing a threshold of nucleotide conservation (78% < id < 82%) below which growth rates drastically reduce. Data are presented as mean ± SD (n = 6 for Sc, n = 3 for ScNI, Sc[Ca], Sc[Sp] and Sc[At]; technical replicates). Pearson correlation coefficient r is considered nonsignificant if P > 0.05.
Evaluation of monomeric‐to‐filamentous actin ratios. Data are presented as mean ± SD (n = 12 for Sc and ScNI and 4 for Sc[Ca], Sc[Sp] and Sc[At]; 2 biological replicates with n/2 technical replicates each). (Brown–Forsythe and Welch ANOVA tests, with Dunnett’s T3 multiple comparisons tests).
Source data are available online for this figure.

