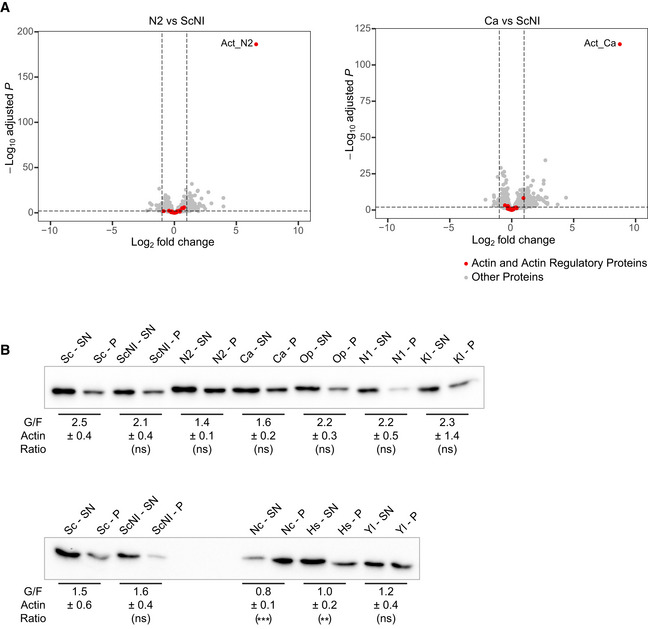
Figure EV2. Effects of swapping actin for different variants on gene expression and monomeric‐to‐filamentous actin ratio, related to Fig 3.

- Differential gene expression of Ca and N2 strains compared to ScNI strain. Y‐axis represents the adjusted P‐value of FDR (False Discovery Rate) calculated with Benjamini and Hochberg method, and X‐axis fold‐changes. Red dots highlight proteins of interest (actin and 32 regulatory proteins) and grey dots represent all the other proteins identified by RNA‐seq.
- Evaluation of monomeric‐to‐filamentous actin ratios. Control strains and strains expressing the most (resp. the least) conserved actin variants are analyzed in the upper (resp. the lower) western blot. Data are presented as mean ± SD (n = 12 for Sc and ScNI and n = 4 for all other conditions; 2 biological replicates with n/2 technical replicates each). **P < 0.01, ***P < 0.001 (Brown–Forsythe and Welch ANOVA tests, with Dunnett’s T3 multiple comparisons tests).
Source data are available online for this figure.
