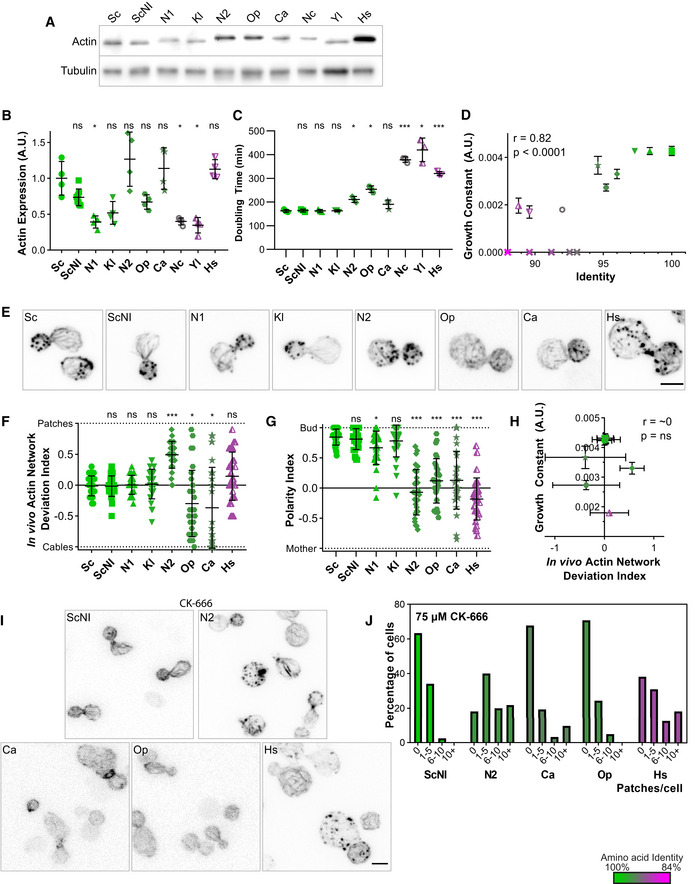
Figure 3. Effects of swapping actin for different variants on cell viability and cytoskeletal organization.

In this figure, the shape of the dots allows to identify the strains on the different graphs (closed circles for Sc, closed squares for ScNI, closed triangles for N1, inversed closed triangles for Kl, closed diamonds for N2, closed pentagons for Op, stars for Ca, open circles for Nc, half‐open triangles for Yl, half‐open inversed triangles for Hs and crosses for nonviable strains). The color of the dots indicates the percentage of identity of the amino acid sequences to S. cerevisiae’s actin, ranging from 100% (green) to 84% (magenta).
- Actin expression levels shown by western blotting for strains expressing S. cerevisiae’s actin or other actins, with tubulin (Tub1p) as a loading control.
- Quantification of actin expression levels showing varying levels of expression that do not correlate with evolutionary relationship. Data are presented as mean ± SD (n = 8 for ScNI, n = 4 for all other strains; 2 biological replicates with n/2 technical replicates each). *P < 0.05 (Brown–Forsythe and Welch ANOVA tests, with Dunnett’s T3 multiple comparisons tests).
- Doubling times of yeast strain cultures grown at 25°C in YPD medium. Data are presented as mean ± SD (n = 3 for all conditions; technical replicates). *P < 0.05, ***P < 0.001 (Brown–Forsythe and Welch ANOVA tests, with Dunnett’s T3 multiple comparisons tests).
- Growth constant as a function of percentage identity of the actin variant, showing clear correlation (n = 3 for all conditions; technical replicates). Data are presented as mean ± SD. r corresponds to the Pearson correlation coefficient with a two‐tailed P value and a confidence interval of 95%.
- Phalloidin staining of F‐actin organization. Images are maximum intensity projections of 3D stacks and contrasts were adapted due to the fact that phalloidin labeling had a very different efficiency depending on the actin ortholog expressed. Micrographs of Sc and Sc_NI cells are reproduced from Fig 2E. Scale bar: 3 µm.
- In vivo actin network deviation indexes. Data are presented as mean ± SD (n = 30 for all conditions). *P < 0.05, ***P < 0.001 (Brown–Forsythe and Welch ANOVA tests, with Dunnett’s T3 multiple comparisons tests).
- Polarity indexes. Data are presented as mean ± SD (n = 30 for all conditions). *P < 0.05, ***P < 0.001 (Brown–Forsythe and Welch ANOVA tests, with Dunnett’s T3 multiple comparisons tests).
- Growth constant as a function of the in vivo actin network deviation index. Data are presented as mean ± SD (for growth constants, n = 3 for all conditions; technical replicates; for indexes, n = 30 for all conditions). r is a Pearson correlation coefficient considered nonsignificant if its two‐tailed P‐value is > 0.05.
- Effect of CK‐666 (75 µM) on the organization of the actin cytoskeleton. Cells were stained with phalloidin after 30 min incubation with CK‐666. Images are maximum intensity projections of 3D stacks. Scale bar: 3 µm.
- Quantification of actin patch resistance to CK‐666 treatment. Bar graphs represent the percentage of cells with a given number of visible actin patches after CK‐666 treatment. (n = 41 for ScNI, 55 for N2, 31 for Ca, 41 for Op, 55 for Hs).
Data information: Abbreviations: ns—nonsignificant, Sc – wild‐type S. cerevisiae cells, ScNI – S. cerevisiae cells where the actin gene has been replaced with the wild‐type gene but without the intron, the other abbreviations correspond to cells expressing actins from other species (for the list of species see Table EV1 or Fig 1).
Source data are available online for this figure.
