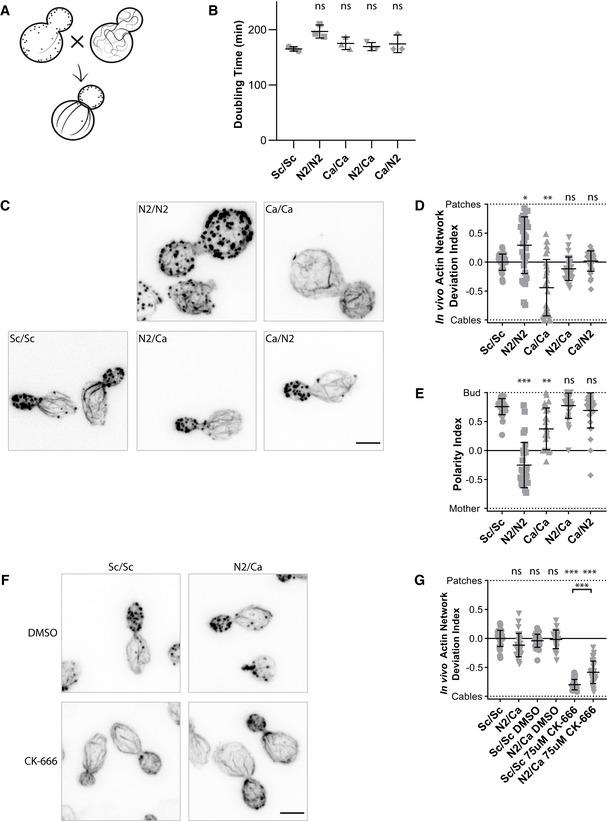
Figure 6. Effect of a dual expression of actins on cell viability and cytoskeletal organization.

- Schematic of the experiment performed in a diploid yeast background.
- Doubling times of diploid yeast strains cultures, grown at 25°C in YPD medium. N2/Ca and Ca/N2 cells express the same actins but markers used for selection are exchanged. Data are presented as mean ± SD (n = 3 for all conditions; technical replicates). (Brown–Forsythe and Welch ANOVA tests, with Dunnett’s T3 multiple comparisons tests).
- Phalloidin staining depicting F‐actin organization. Images are maximum intensity projections of 3D stacks. Scale bar: 3 µm.
- In vivo actin network deviation indexes. Data are presented as mean ± SD (n = 30 for all conditions). *P < 0.05, **P < 0.01 (Brown–Forsythe and Welch ANOVA tests, with Dunnett’s T3 multiple comparisons tests).
- Polarity Indexes. Data are presented as mean ± SD (n = 30 for all conditions). **P < 0.01, ***P < 0.001 (Kruskal–Wallis test, with multiple comparisons).
- Effect of CK‐666 (75 µM) on the organization of the actin cytoskeleton. Cells were stained with phalloidin after 30‐min incubation with CK‐666. Images are maximum intensity projections of 3D stacks. Scale bar: 3 µm.
- In vivo actin network deviation indexes of cells treated with DMSO or CK‐666. Data are presented as mean ± SD (n = 30 for all conditions). ***P < 0.001 (Brown–Forsythe and Welch ANOVA tests, with Dunnett’s T3 multiple comparisons tests).
Data information: Each strain is represented by a dot of specific shape in all panels. Abbreviations: ns—nonsignificant, Sc/Sc—wild‐type diploid S. cerevisiae cells, N2/N2 –diploid S. cerevisiae cells expressing only N2 actin, Ca/Ca—diploid S. cerevisiae cells expressing only C. albicans actin, N2/Ca and Ca/N2—diploid S. cerevisiae cells expressing N2 actin and C. albicans actin at the same time (for more details, see Table EV1, Fig 1, and Appendix Fig S1B and C).
Source data are available online for this figure.
