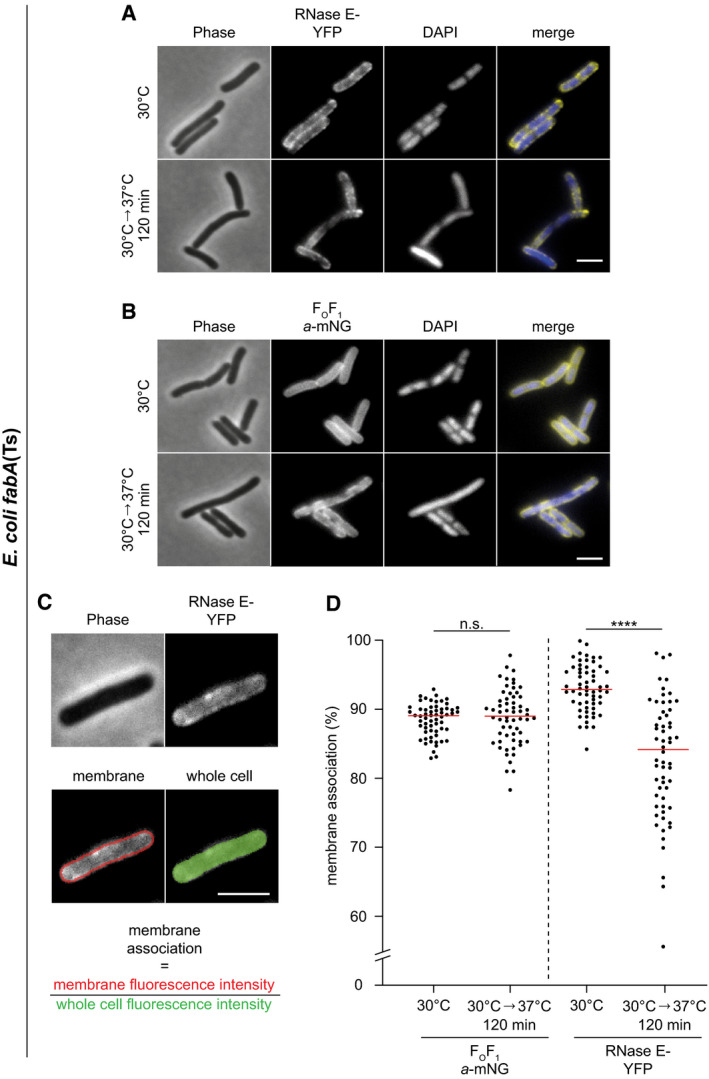
Figure EV2. Very low membrane fluidity triggers partial dissociation of RNase E from the membrane in E. coli fabA(Ts).

-
A, BPhase‐contrast and fluorescence images of E. coli fabA(Ts) strain expressing (A) RNase E‐YFP or (B) FOF1 a‐mNG. Cells were grown in LB at 30°C to an OD600 of 0.3, transferred to the non‐permissive temperature of 37°C for 120 min followed by labelling with DAPI and fluorescence microscopy. Note the increasing cytoplasmic localisation of RNase E‐YFP upon depletion of the membrane for UFA, which coincides with decondensation of the nucleoid (compare Fig 4B).
-
CQuantification of membrane association of RNase E. The degree of membrane association was quantified by automated detection of cells using phase‐contrast images, defining a 3‐pixel wide band around the periphery of the cell, and measuring the relative membrane association as a ratio between the mean peripheral fluorescence signal and the mean fluorescence of the whole cell.
-
DRelative membrane association of FOF1 a‐mNG and RNase E‐YFP at 30°C and 37°C for 120 min in individual cells (n = 60). Red lines indicate the median.
Data information: (A–D) Experiments are representative of independent biological duplicates. (D) Red lines indicate the median. P values represent the results of unpaired, two‐sided t‐tests. Significance was assumed with ****P < 0.0001, n.s., not significant (A–C). Scale bar: 3 µm. Strains used: (A, C, D) E. coli UC1098/pVK207; (B, D) E. coli MG4.
Source data are available online for this figure.
