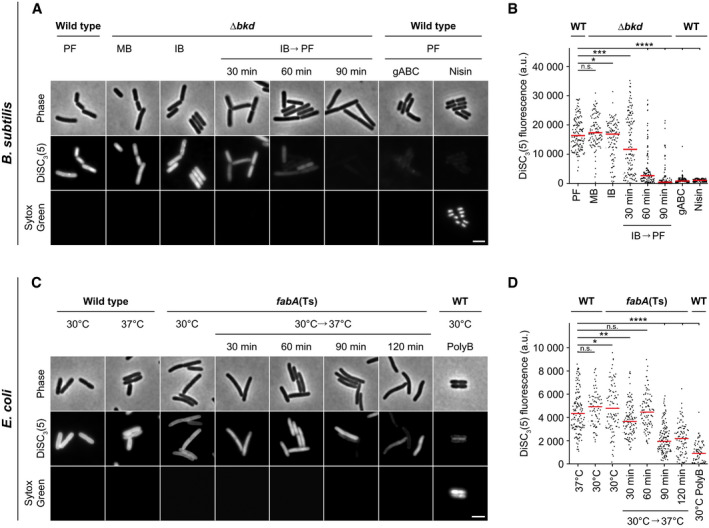
Figure 3. Consequences of low membrane fluidity on membrane diffusion barrier function.

- Images of B. subtilis WT and Δbkd cells co‐labelled with the membrane potential‐sensitive dye DISC3(5) and the membrane permeability indicator Sytox Green. Membrane properties were assessed for Δbkd cells grown in the presence of MB, IB or washed precursor‐free (IB→PF) for the times indicated. As controls, WT cells were measured in the presence of depolarising antimicrobial peptide gramicidin ABC (gABC) or pore‐forming lantibiotic Nisin. For cross‐correlation between membrane depolarisation and membrane permeabilisation, see Appendix Fig S3A–C.
- Quantification of DISC3(5) fluorescence for cells (n = 100–142) depicted in panel A. Median represented by red line.
- Images of E. coli WT and fabA(Ts) cells co‐labelled with the same indicator dyes as in panel A. Membrane properties were assessed for fabA(Ts) at 30°C and upon transfer to non‐permissive 37°C for the times indicated. As controls, WT cells were incubated with the pore‐forming antibiotic Polymyxin B (PolyB). For cross‐correlation between membrane depolarisation and membrane permeabilisation, see Appendix Fig S3D and E. The integrity of the diffusion barrier function was additionally studied via ONPG permeability in a ΔlacY background (see Fig EV1).
- Quantification of DISC3(5) fluorescence for cells (n = 76–141) depicted in panel C. Median represented by red line.
Data information: (A–D) The experiments are representative of three independent repeats. (B, D) Red lines indicate the median. P values represent the results of unpaired, two‐sided t‐tests. Significance was assumed with ****P < 0.0001, ***P < 0.001, **P < 0.01, *P < 0.05, n.s., not significant. (A, C) Scale bar, 3 µm. Strains used: (A, B) B. subtilis 168, HS527; (C, D) E. coli Y‐Mel, UC1098.
Source data are available online for this figure.
